First, I collected sprint data from several of Atomic’s past projects, ranging from short engagements to multi-year marathons. I wanted to study what formula best predicted a team’s final velocity based solely on past sprints.
Estimating a project’s completion date can involve a lot of variables: teams expand or contract, individual team members are swapped out, schedules shift, tools improve, and technical debt accrues. Often, these variables can’t be known, measured, or appropriately accounted for, especially in advance. If you try to factor all of these variables into your prediction, you’ll end up fitting past data very well, but you probably won’t make a very good future estimate.
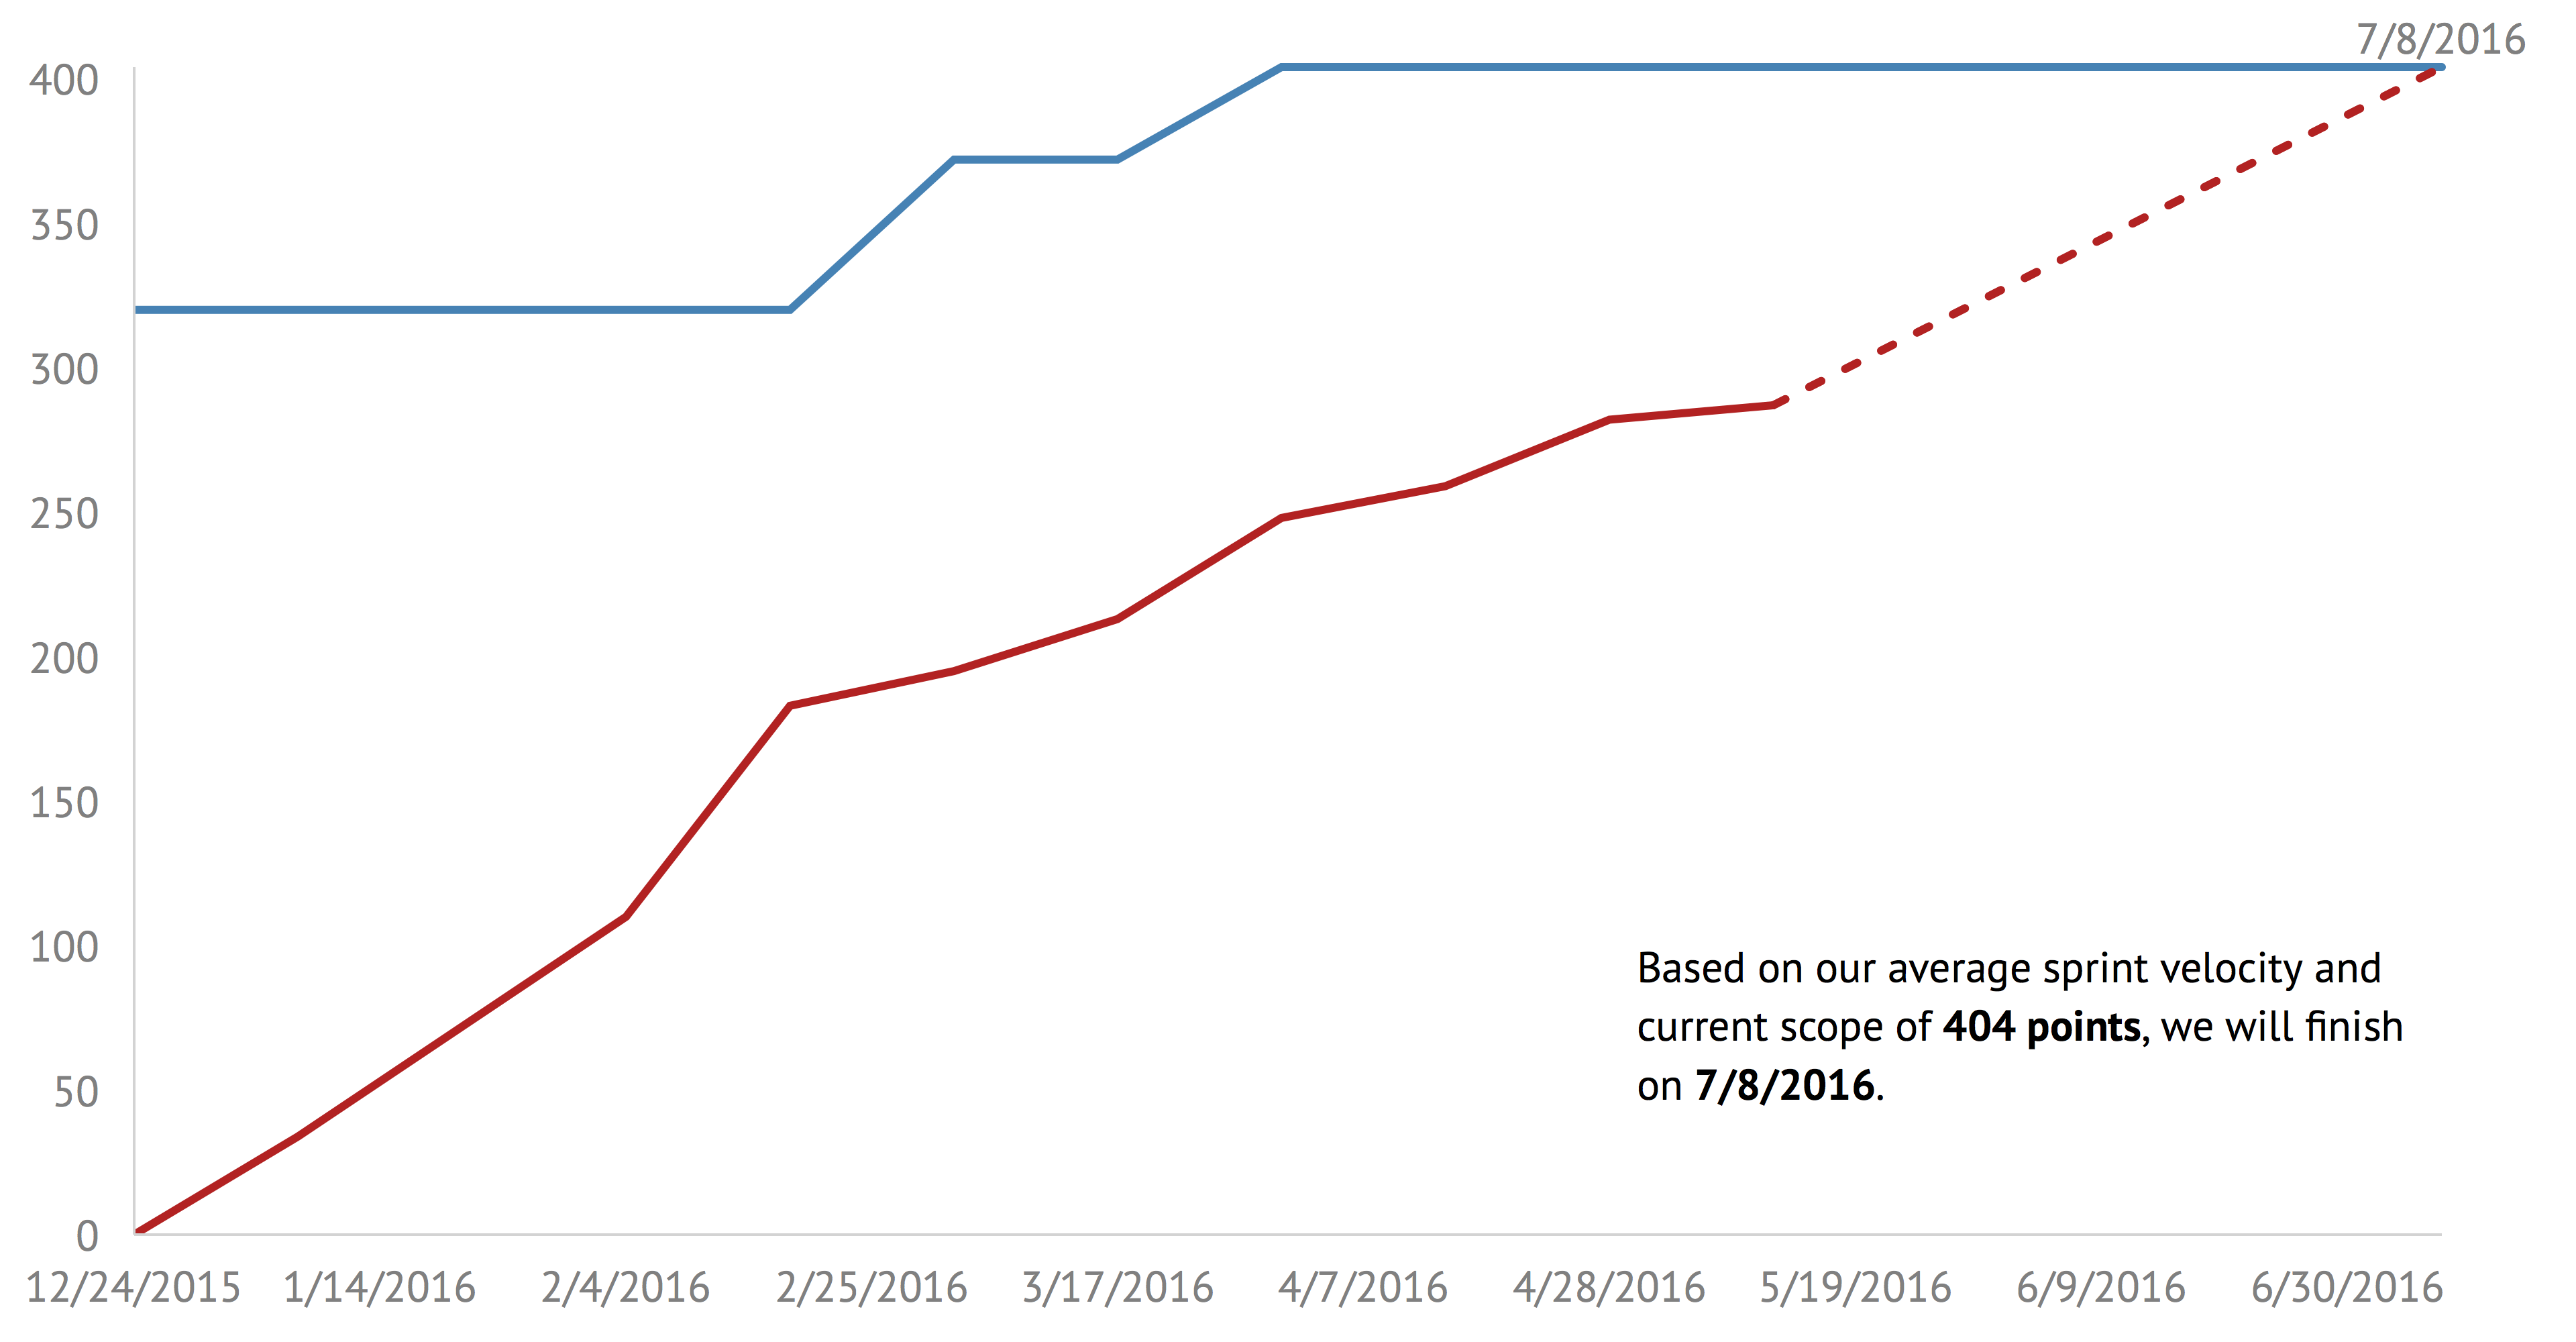
The least possible data to use for estimating a finish date are the historical sprint velocities and the project scope—two pieces of data that can be very easily and accurately measured.
Unfortunately, as I looked at Atomic’s past projects, I realized that scope is anything but stable. It can vary wildly through the lifetime of a project. Sometimes it starts by climbing steeply, while the client and team figure out what should be built. Sometimes it fluctuates as clients change their mind. Sometimes it drops suddenly or grows steadily, depending more on the client’s budget than the initial work agreement.
Because project scopes can be so unpredictable, we can’t rely on scope to consistently estimate when a team will finish their work. Instead, I had to ignore scope and see how well I could predict a team’s final average velocity from sprint velocities alone.
There are several common formulas, but it turns out that the best way to forecast the final average from any given sprint is simply to average all the sprint velocities that came before it. The average of the initial sprints won’t give very accurate predictions, but over time, the estimate stabilizes.
There’s a temptation to use more sophisticated formulas than mere averaging. Some teams average only the last three sprints, or they weight the most recent sprint more heavily than the ones before it. Based on Atomic’s past projects, these strategies yield very erratic estimates. They tend to follow sprint-to-sprint variability and never settle onto a particular finish date. If you want to show clients recent trends in sprint velocities without the noise of individual sprints, you can use a rolling average, but I wouldn’t use a rolling average to predict when the team will finish.
As part of this research, I made a basic burn chart generator. I’ve seen lots of different ways to make burn charts, from using spreadsheets like Excel and Numbers to manually editing vector graphics in programs like Sketch.
If you’d rather not fiddle with spreadsheets or math or manual graphing, you’re welcome to use my generator. Just drag and drop a CSV of your sprint data and export an image. Hope that helps with your estimating.