
I recently needed to find and fix a bug in a web app I’ve been working on. The bug had something to do with code that was updating the dimensions of a third-party generated UI component whenever the window was resized. While troubleshooting the issue, I repeatedly used a handful of the tools provided by Chrome DevTools. Some of these I’ve used many times in the past, but a couple of them were new to me, so I thought I’d discuss them here.
1. Pass Adhoc Objects to console.log
When I’m trying to debug something, I often start with some console.log statements to give me a better idea of what’s actually happening in the code. Usually, these are just strings with a value or two mixed in like so:
console.log('The current height is', height, 'and width is', width);
DevTools lets you expand objects that are passed to console.log, making it a great way to dump out a larger collection of variables using an ad-hoc object. For example,
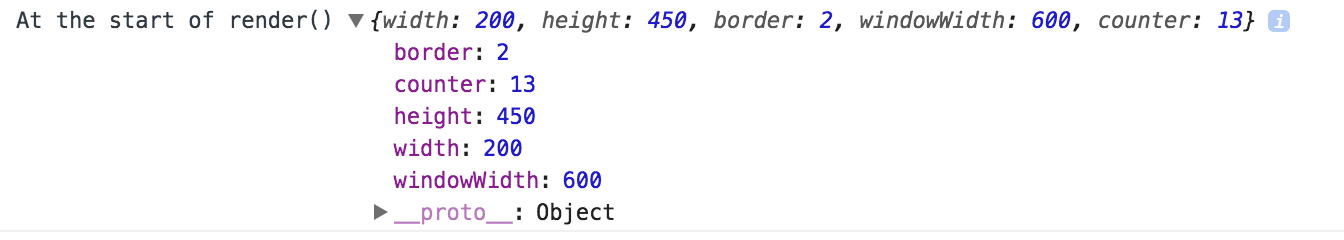
console.log("At the start of render()", {width, height, border, windowWidth, counter});
will show up in the console like this:
![]()
And if you expand the object by clicking on the arrow, you can see the values in a more readable layout. (This is especially helpful when the object has too many properties to fit on a single line.)
2. Reference the Selected Node in the Console
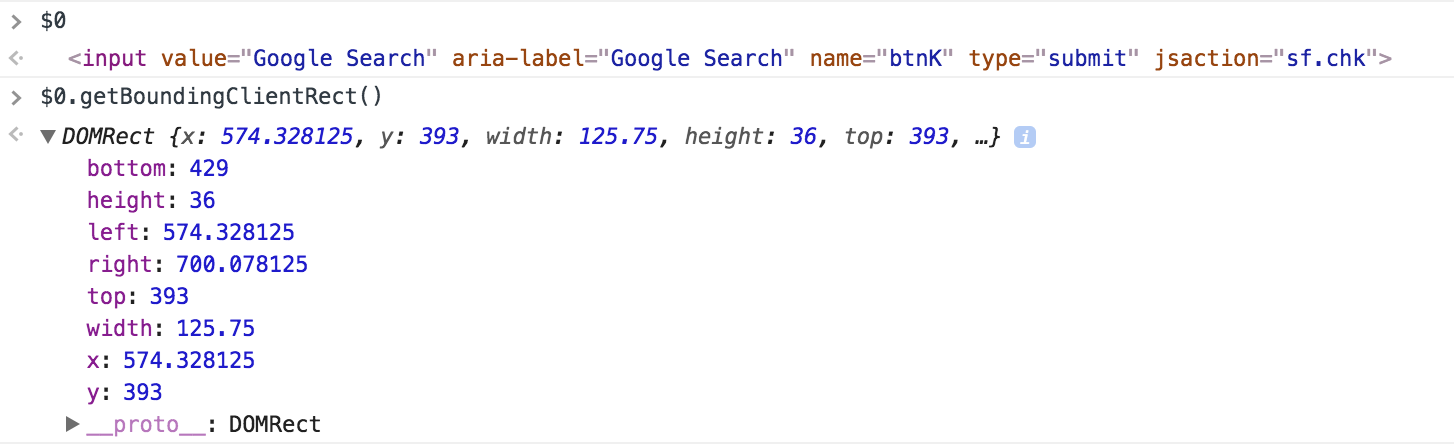
When an element is selected in DevTools, it can be referenced in the console using the $0 variable. This allows you to inspect the DOM node to get its position and dimensions using $0.getBoundingClientRect(), or manipulate it in any programmatic way you’d like.
3. Use Find in the Elements Tab
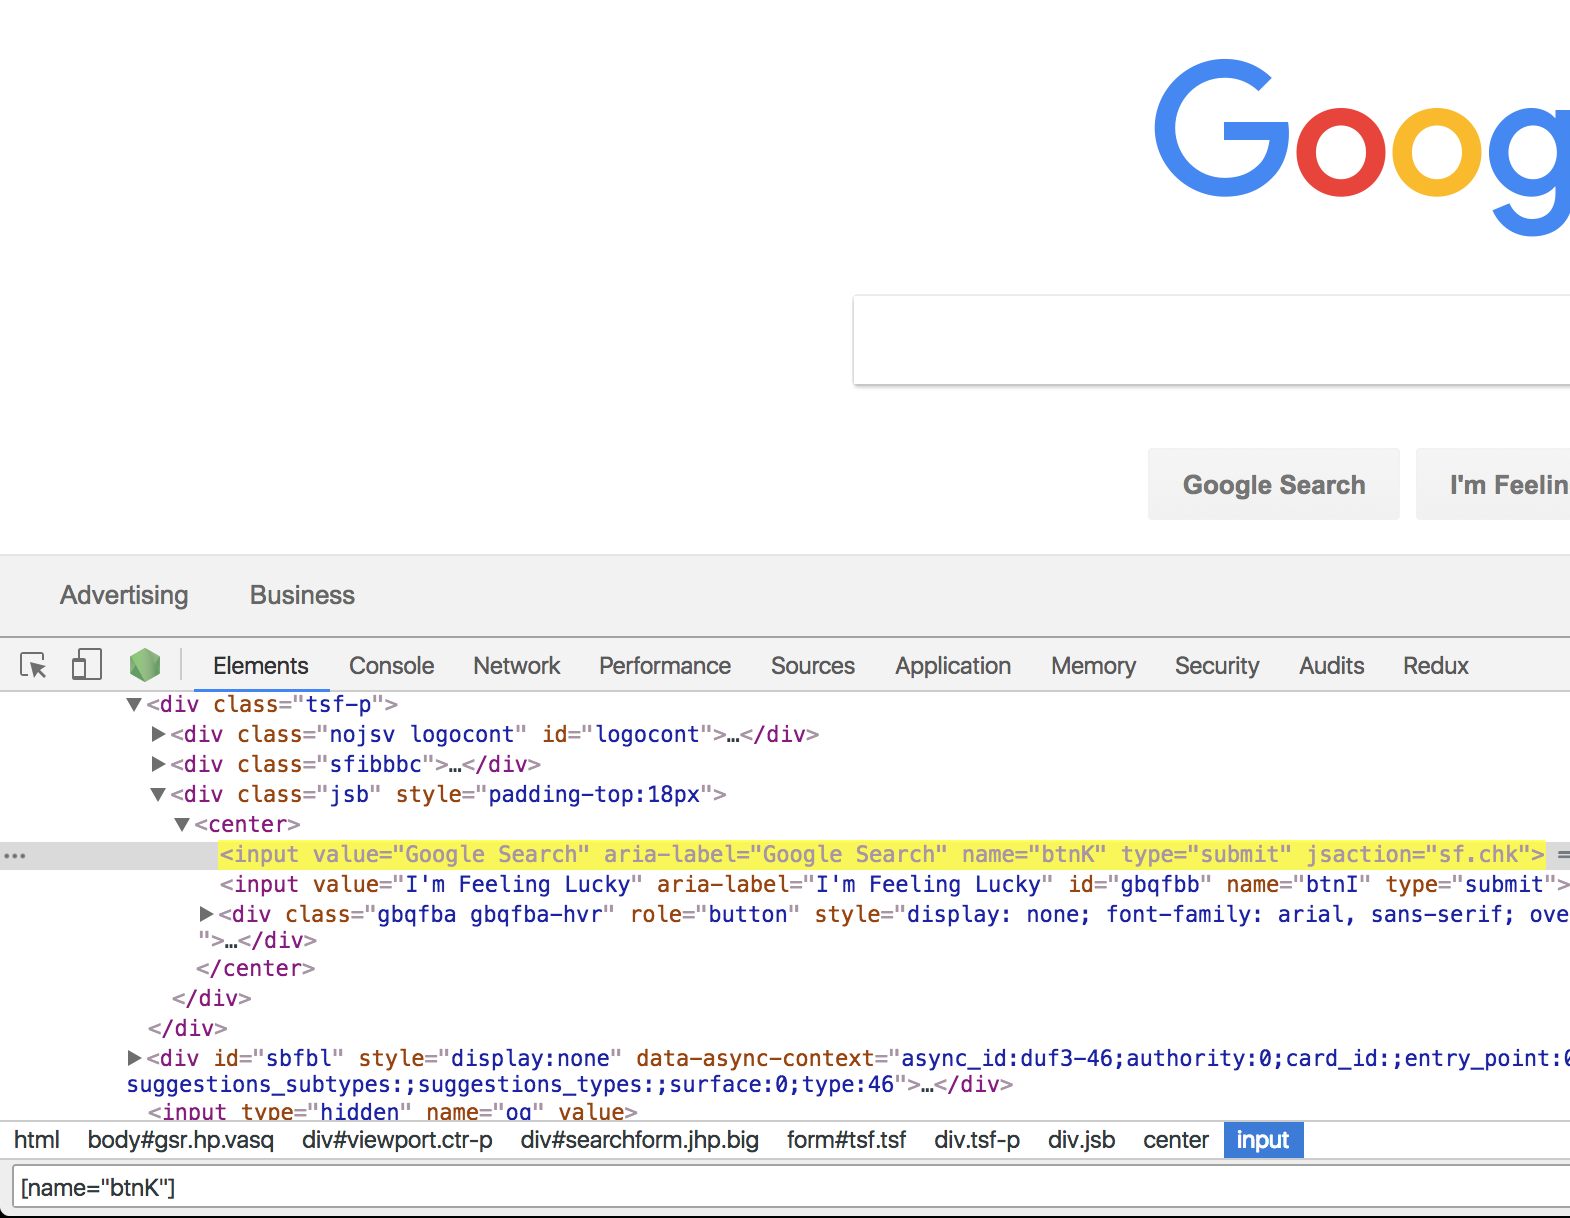
When you’re trying to find a deeply nested node in the DOM in the DevTools Elements tab, relying on the user interface to select it isn’t very accurate. It often requires a lot of clicks to expand node after node, just to get down to the one you want.
A faster way is to use Find. With the Elements tab focused, use Cmd-F/Ctrl-F to open a Find bar, and type in a CSS selector to locate the node you’re looking for:
4. Conditional Breakpoints
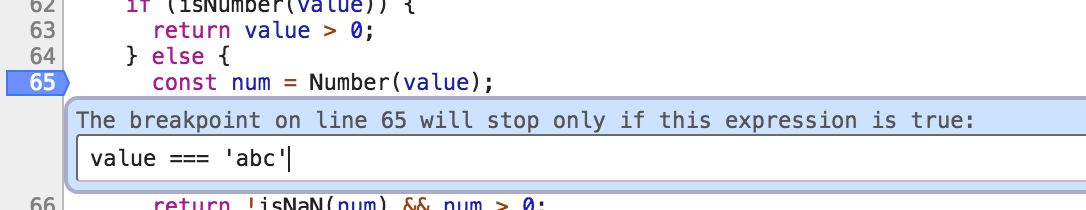
Chrome DevTools provides a powerful debugger, including the ability to configure conditional breakpoints that will only stop if some condition is met. If you right-click on a breakpoint and select Edit breakpoint..., you’ll be able to specify a condition.
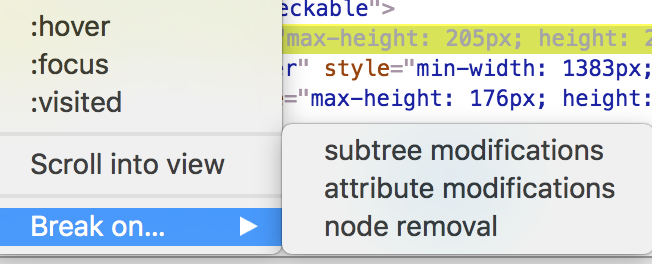
5. DOM Breakpoints
DevTools allows you to set a breakpoint on a DOM node that will break if the node’s attributes change, its subtree changes, or it is removed. To set a DOM breakpoint, find the element you want in the Elements tab, right-click it, and select Break on.... You can choose which type of breakpoint to set.
Conclusion
Chrome’s DevTools are incredibly powerful. It seems like I find a new feature every time I’m trying to debug a problem. The ones I listed in this post were extremely helpful to me recently. Hopefully, you’ll find them useful as well.