
Splunk is a great tool for searching, reviewing, and manipulating data. Unfortunately, it can be hard to figure out how to use a list of results from one Splunk panel in another panel. Here’s the method that works for me.
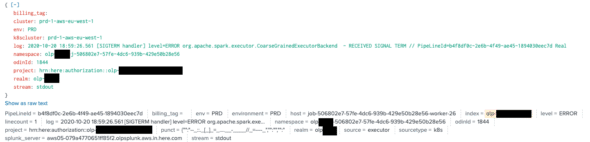
For simplicity’s sake, I’ll be using info logger data from pipeline runs. They look something like this:
Let’s say you want to take a list of namespaces (from successful runs) from one panel and use it in another panel. We can get the namespaces with a search like this:
<search>
    <query>
    index=*_common '{"status": "finished", "returnValue": 0}'
    | rex "\"namespace\":\"(?<namespace>.*)\","
    | dedup namespace
    | stats list(namespace) AS namespaces
    | table namespaces
    </query>
    <earliest>-30d@d</earliest>
    <latest>now</latest>
</search>
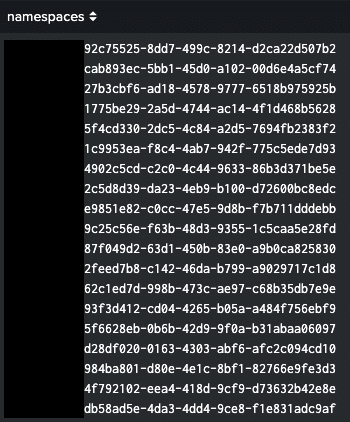
Our output will look like this:
Then we can set a token that will hold this result:
<search>
    <done>
        <set token="successfulNamespaces">$result.namespaces$</set>
    </done>
    <query>
        index=*_common '{"status": "finished", "returnValue": 0}'
        | rex "\"namespace\":\"(?<namespace>.*)\","
        | dedup namespace
        | stats list(namespace) AS namespaces
        | table namespaces
    </query>
    <earliest>-30d@d</earliest>
    <latest>now</latest>
</search>
In a second panel, we want to process the logs that have one of these namespaces and compute their elapsed time.
<search>
    <query>
        index=*_common
        | eval namespaces="$successfulNamespaces$"
        | where namespace IN (namespaces)
        | stats
            earliest(_time) AS start_timestamp
            latest(_time) AS end_timestamp
            BY namespace
        | sort start_timestamp
        | eval StartTime=strftime(start_timestamp, "%m/%d/%y %H:%M:%S"), ElapsedTime=(end_timestamp - start_timestamp) / 60
        | table StartTime, ElapsedTime
    </query>
    <earliest>-30d@d</earliest>
    <latest>now</latest>
    <refresh>5m</refresh>
    <refreshType>delay</refreshType>
</search>

We don’t seem to get any results, so what’s the problem?
Let’s evaluate just the $successfulNamespaces$ token and see what that outputs:
<search>
    <query>
        index=*_common
        | eval namespaces="$successfulNamespaces$"
        | dedup namespaces
        | table namespaces
    </query>
    <earliest>-30d@d</earliest>
    <latest>now</latest>
    <refresh>5m</refresh>
    <refreshType>delay</refreshType>
</search>
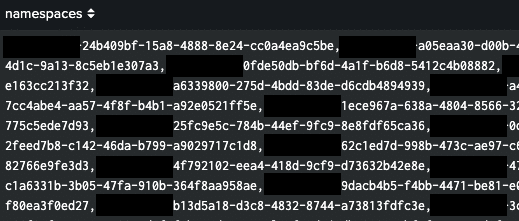
Ah, we can see that when we store a list into a token, it really converts that list into a comma-delimited string. That can be fixed with a split:
<search>
    <query>
        index=*_common
        | eval namespaces=split("$successfulNamespaces$", ",")
        | where namespace IN (namespaces)
        | stats
            earliest(_time) AS start_timestamp
            latest(_time) AS end_timestamp
            BY namespace
        | sort start_timestamp
        | eval StartTime=strftime(start_timestamp, "%m/%d/%y %H:%M:%S"), ElapsedTime=(end_timestamp - start_timestamp) / 60
        | table StartTime, ElapsedTime
    </query>
    <earliest>-30d@d</earliest>
    <latest>now</latest>
    <refresh>5m</refresh>
    <refreshType>delay</refreshType>
</search>
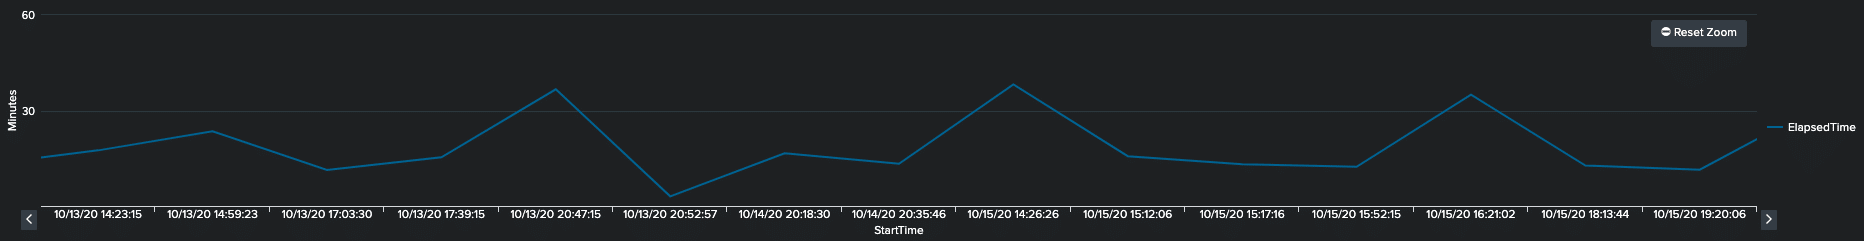
Here we can see the final results, giving the elapsed times for these successful events:
In short, to use a list of results from one Splunk panel in another panel, simply set a token to the list. Then split the resulting string in the panel you want to use it in to get it back into list form.
Helpful.