Making your website analytics data actionable is no easy feat. Maybe you recently launched a new B2C product and want to see how folks are engaging with it online. Or perhaps you just released an updated version of your B2B website and want to get some data on what your client base looks like. With all of the impossible-to-understand data floating around, how can you make use of any of it? ✨ Google Data Studio. ✨
This tool changed the game for my team and has helped us focus our time and energy on analyzing our data rather than on collecting it. Here are a few tips to help you start to make sense of your data with Google Data Studio.
1. Determine your goals.
This step seems like the easiest — just decide what metrics you want to know. No big deal! But to figure out what you need to track in Data Studio… you need to understand your goals. Are you looking for more visitors? Do you want the visitors you already have to engage with the site more deeply? Do you need local engagement?
This doesn’t have to be (and shouldn’t be) a solo task, either. Grab your team for a 30-minute brainstorming session, and try to determine at least three goals for your site. If you need help with structure, try using the SMART goals model.
Specific: Narrow down your goal and make it specific to your business’s needs.
Measurable: Add some numbers! Don’t just say you want to get more leads. Instead, say you want to double your leads!
Attainable: Make sure this is a realistic goal that you could actually meet.
Relevant: Ensure that your goal works with the long-term objectives of your organization. This is where your team comes in!
Timely: Try to set an ambitious but realistic time frame for reaching your goal.
Here is an example of what a SMART goal for a B2B blog might look like:
We would like to double engagement on our blog site. We’ve gathered that around 100 people per day visit our blog so, by Jan 1, 2022, we would like to have an average of 200 daily visitors. If we can double the number of visitors, we believe that we will get more folks to sign up for our webinar in February 2022.
2. Build out your Data Studio dashboard.
Now, this is where the fun starts. Have you ever played Sims before? If you have, you’ll know that building your house is the most fun part of the game. And putting together your Google Data Studio dashboard is almost as fun.

After setting up your account and connecting it with Google Analytics, you’ll see this empty page, just waiting to be filled with data!
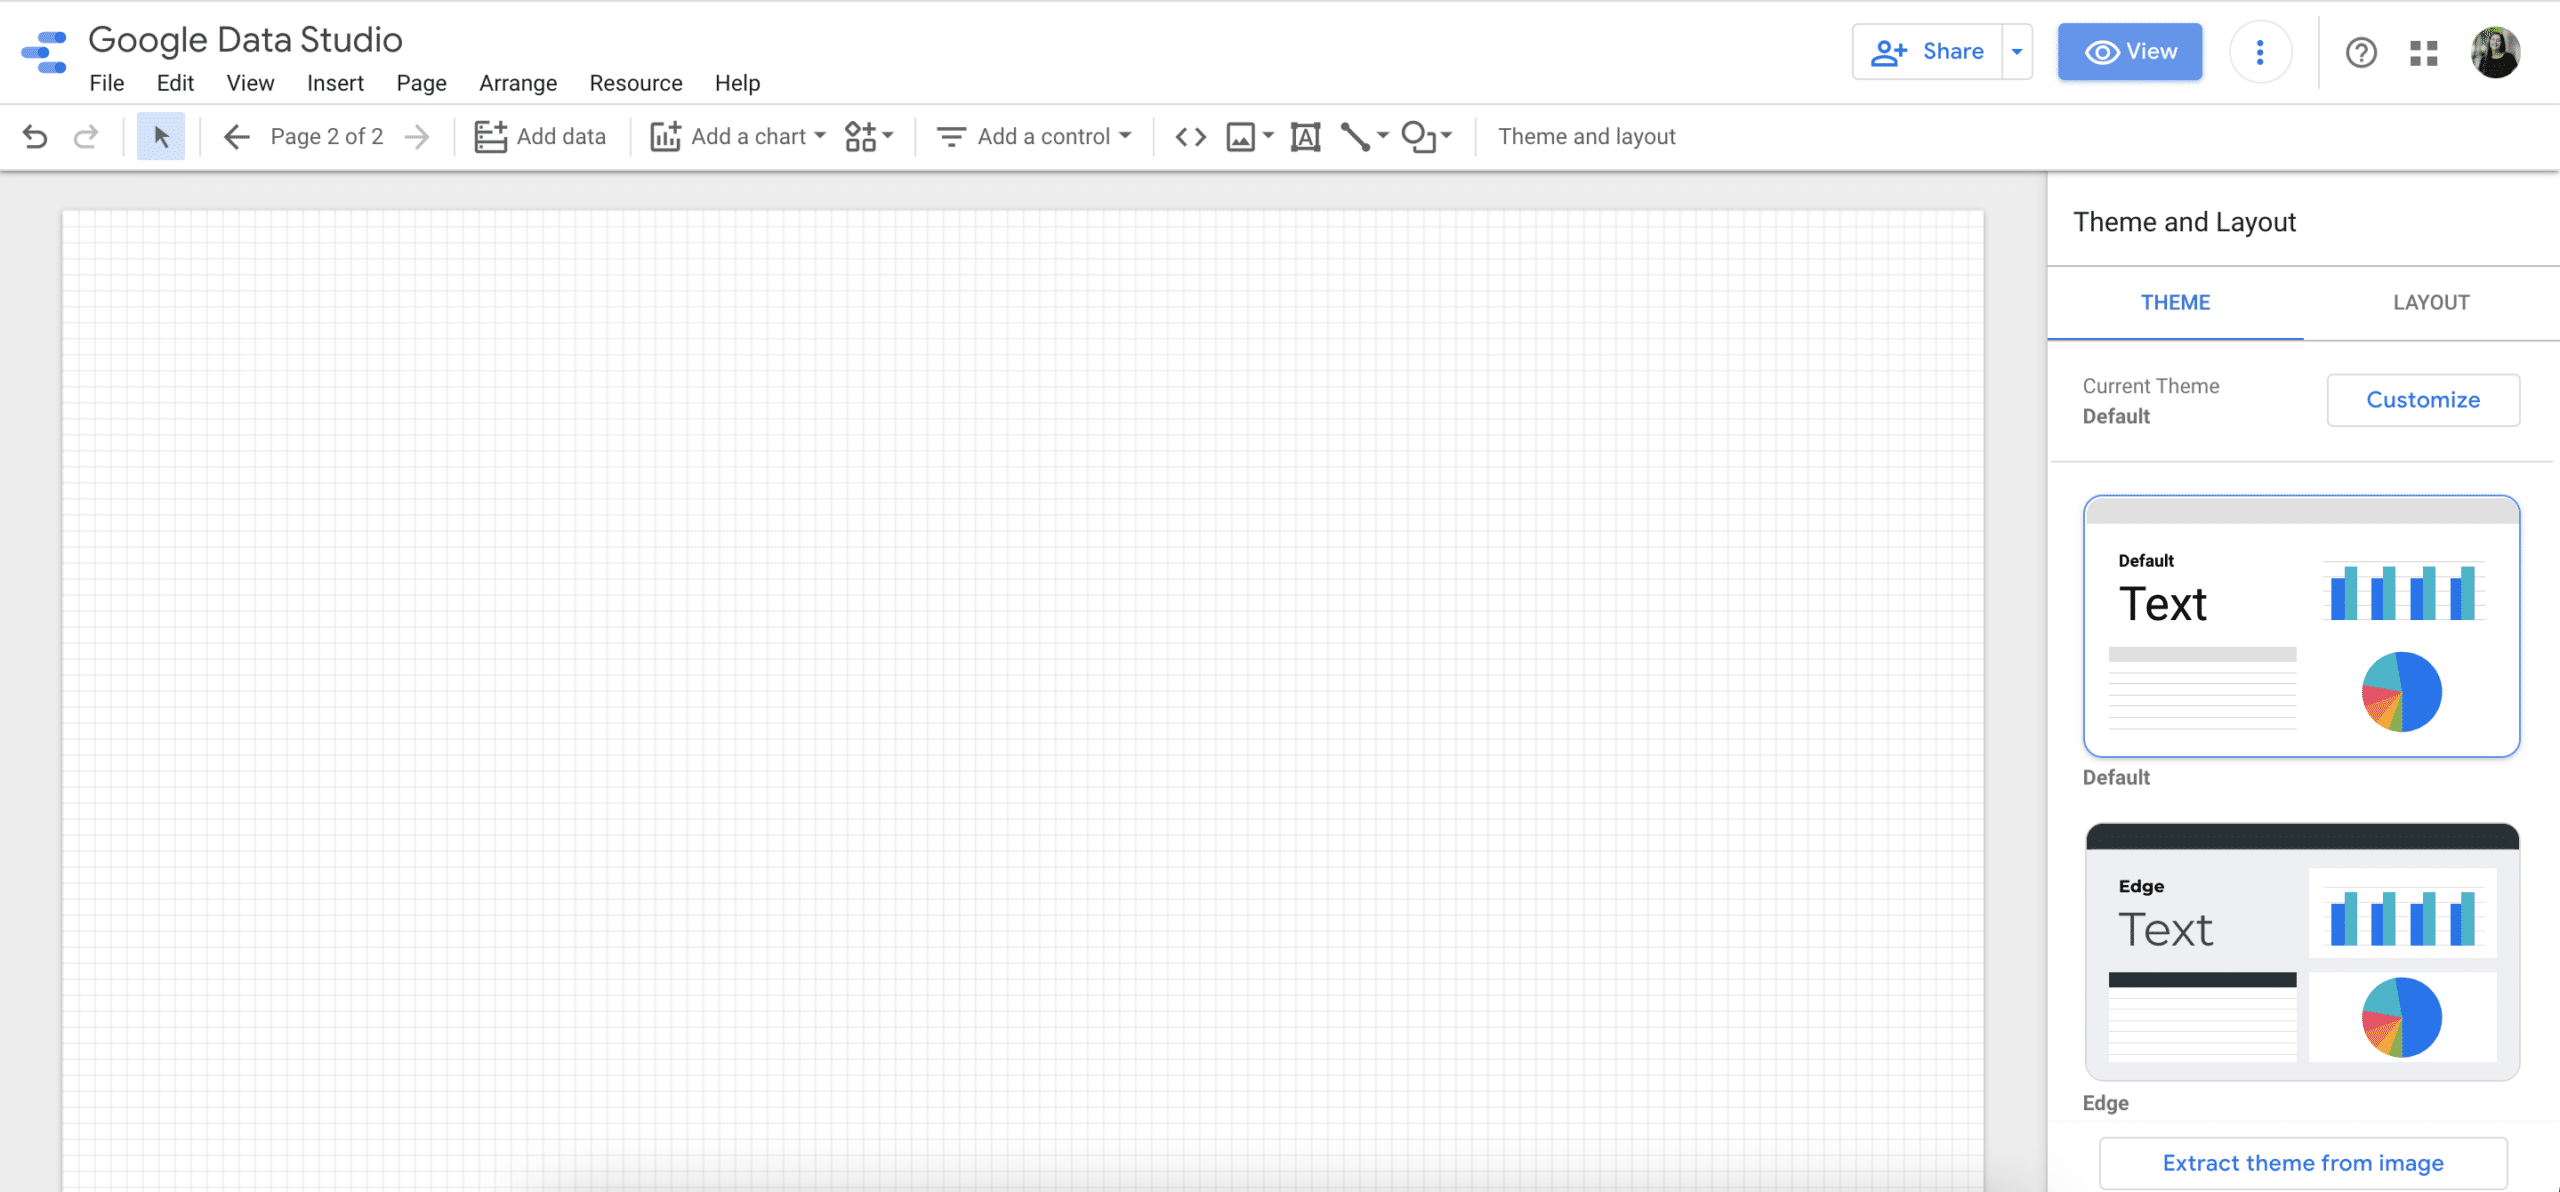
Remember, it takes a while to feel comfortable with any new tool, so don’t get too caught up in the design of the report. You can always come back later and make it ~ fancy ~.
So here’s what you need to do:
- Look at your list of three goals and identify what metrics might help you understand those goals. If, for example, you’re looking to widen engagement on your blog, you should track how many people are coming to each of your blogs.
- Then, think about how you might want to visualize that data. A chart with numbers? A bar graph? If you want to track the number of sessions associated with each post to get a feel for which of your posts are popular, a numbers chart might make the most sense. For the purposes of this post, I used pre-measured data from Google.
- Turn each of your goals in two to three metric visualizations. Now that you understand the basics of turning your goal into a metric and visualizing your metric in Data Studio… go crazy! Fill those pages with metrics and notes about which goal you’re tracking. You’ll want to have a few metrics associated with each goal. If you’re looking to track engagement with your blog posts, try creating these visualizations:
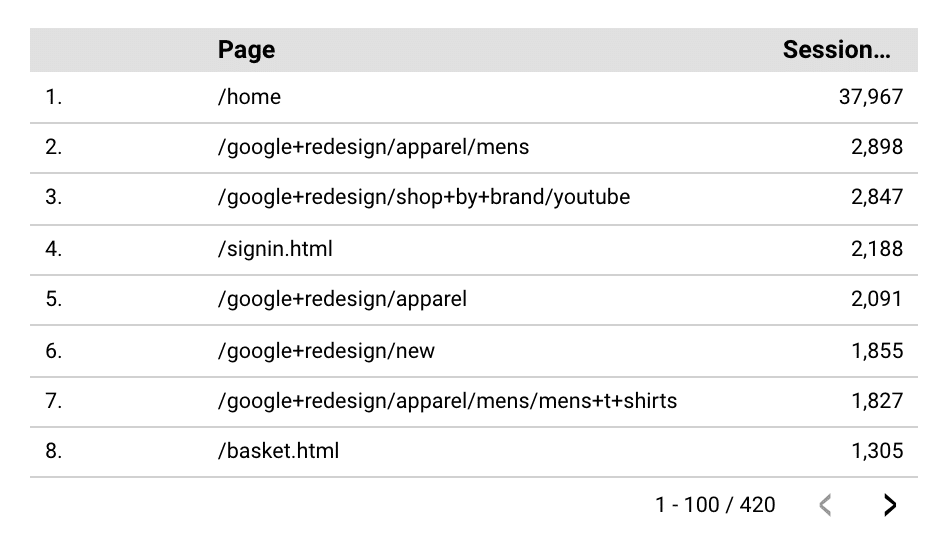
- Page Name + Sessions (which pages are getting the most engagement?)
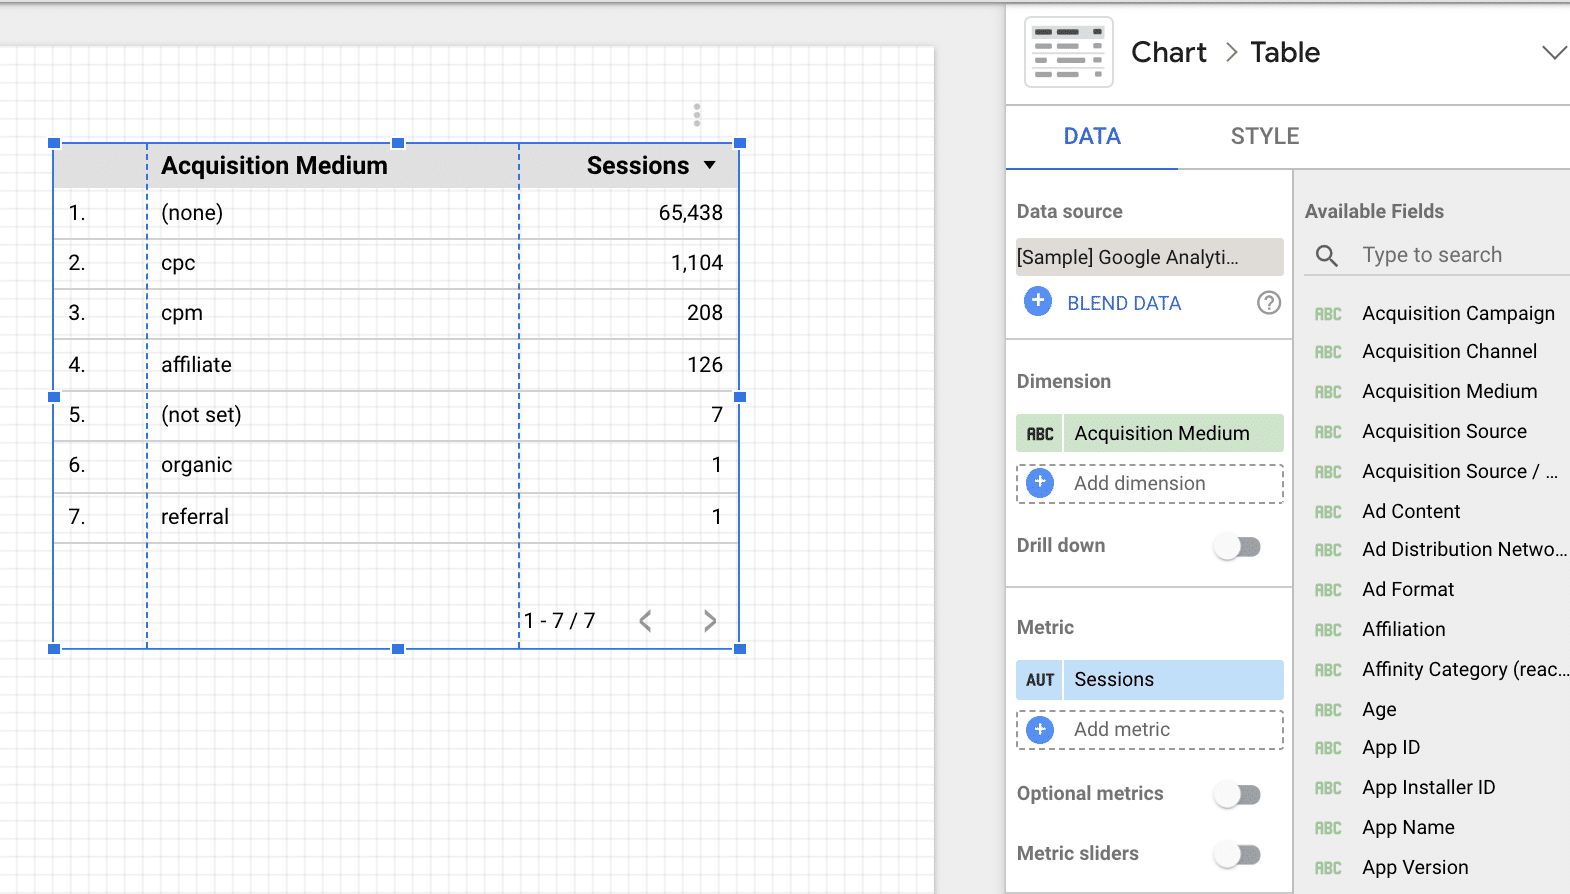
- Acquisition + Sessions (what sources are sending the most traffic your way?)
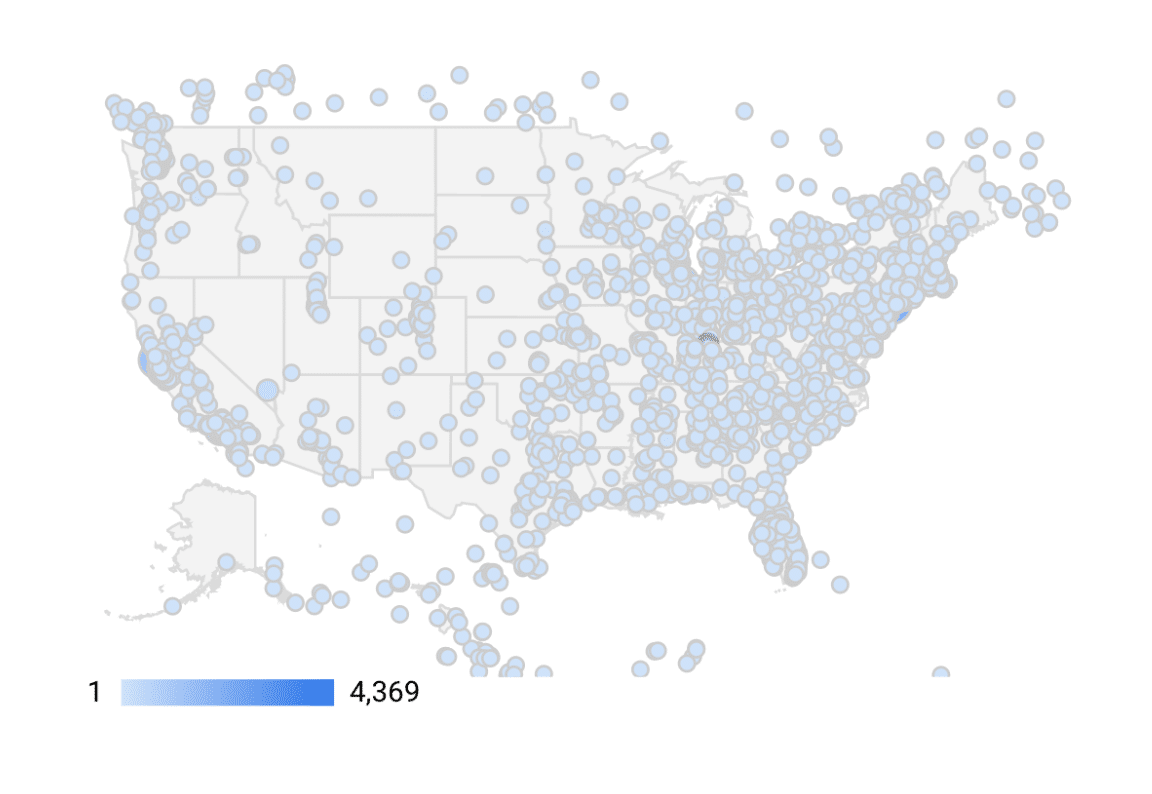
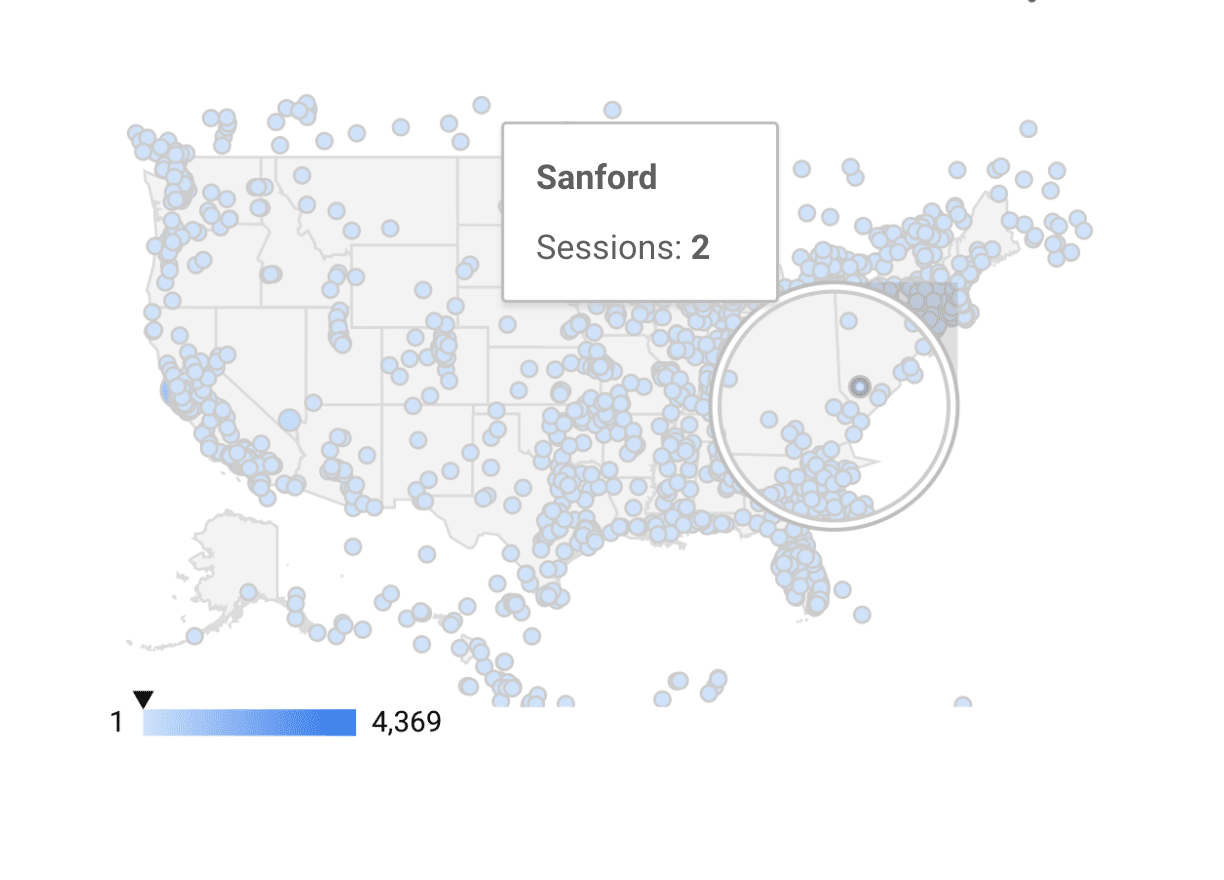
- A user map (where are people coming to your site from? Are there geographic areas of higher interest?)
3. Make your dashboard fun!
I know I literally just said not to stress out about what your dashboard looks like, but once you have the basics of your dashboard set up… add a little flare! Deck out the design with your company brand colors and fonts.
If you have three clear goals defined, dedicate one page of the report for each goal. List the goal clearly at the top of the page and only include metric visualizations that apply to that goal. Organize and design the report in a fun way that makes the data more interesting and exciting for you.
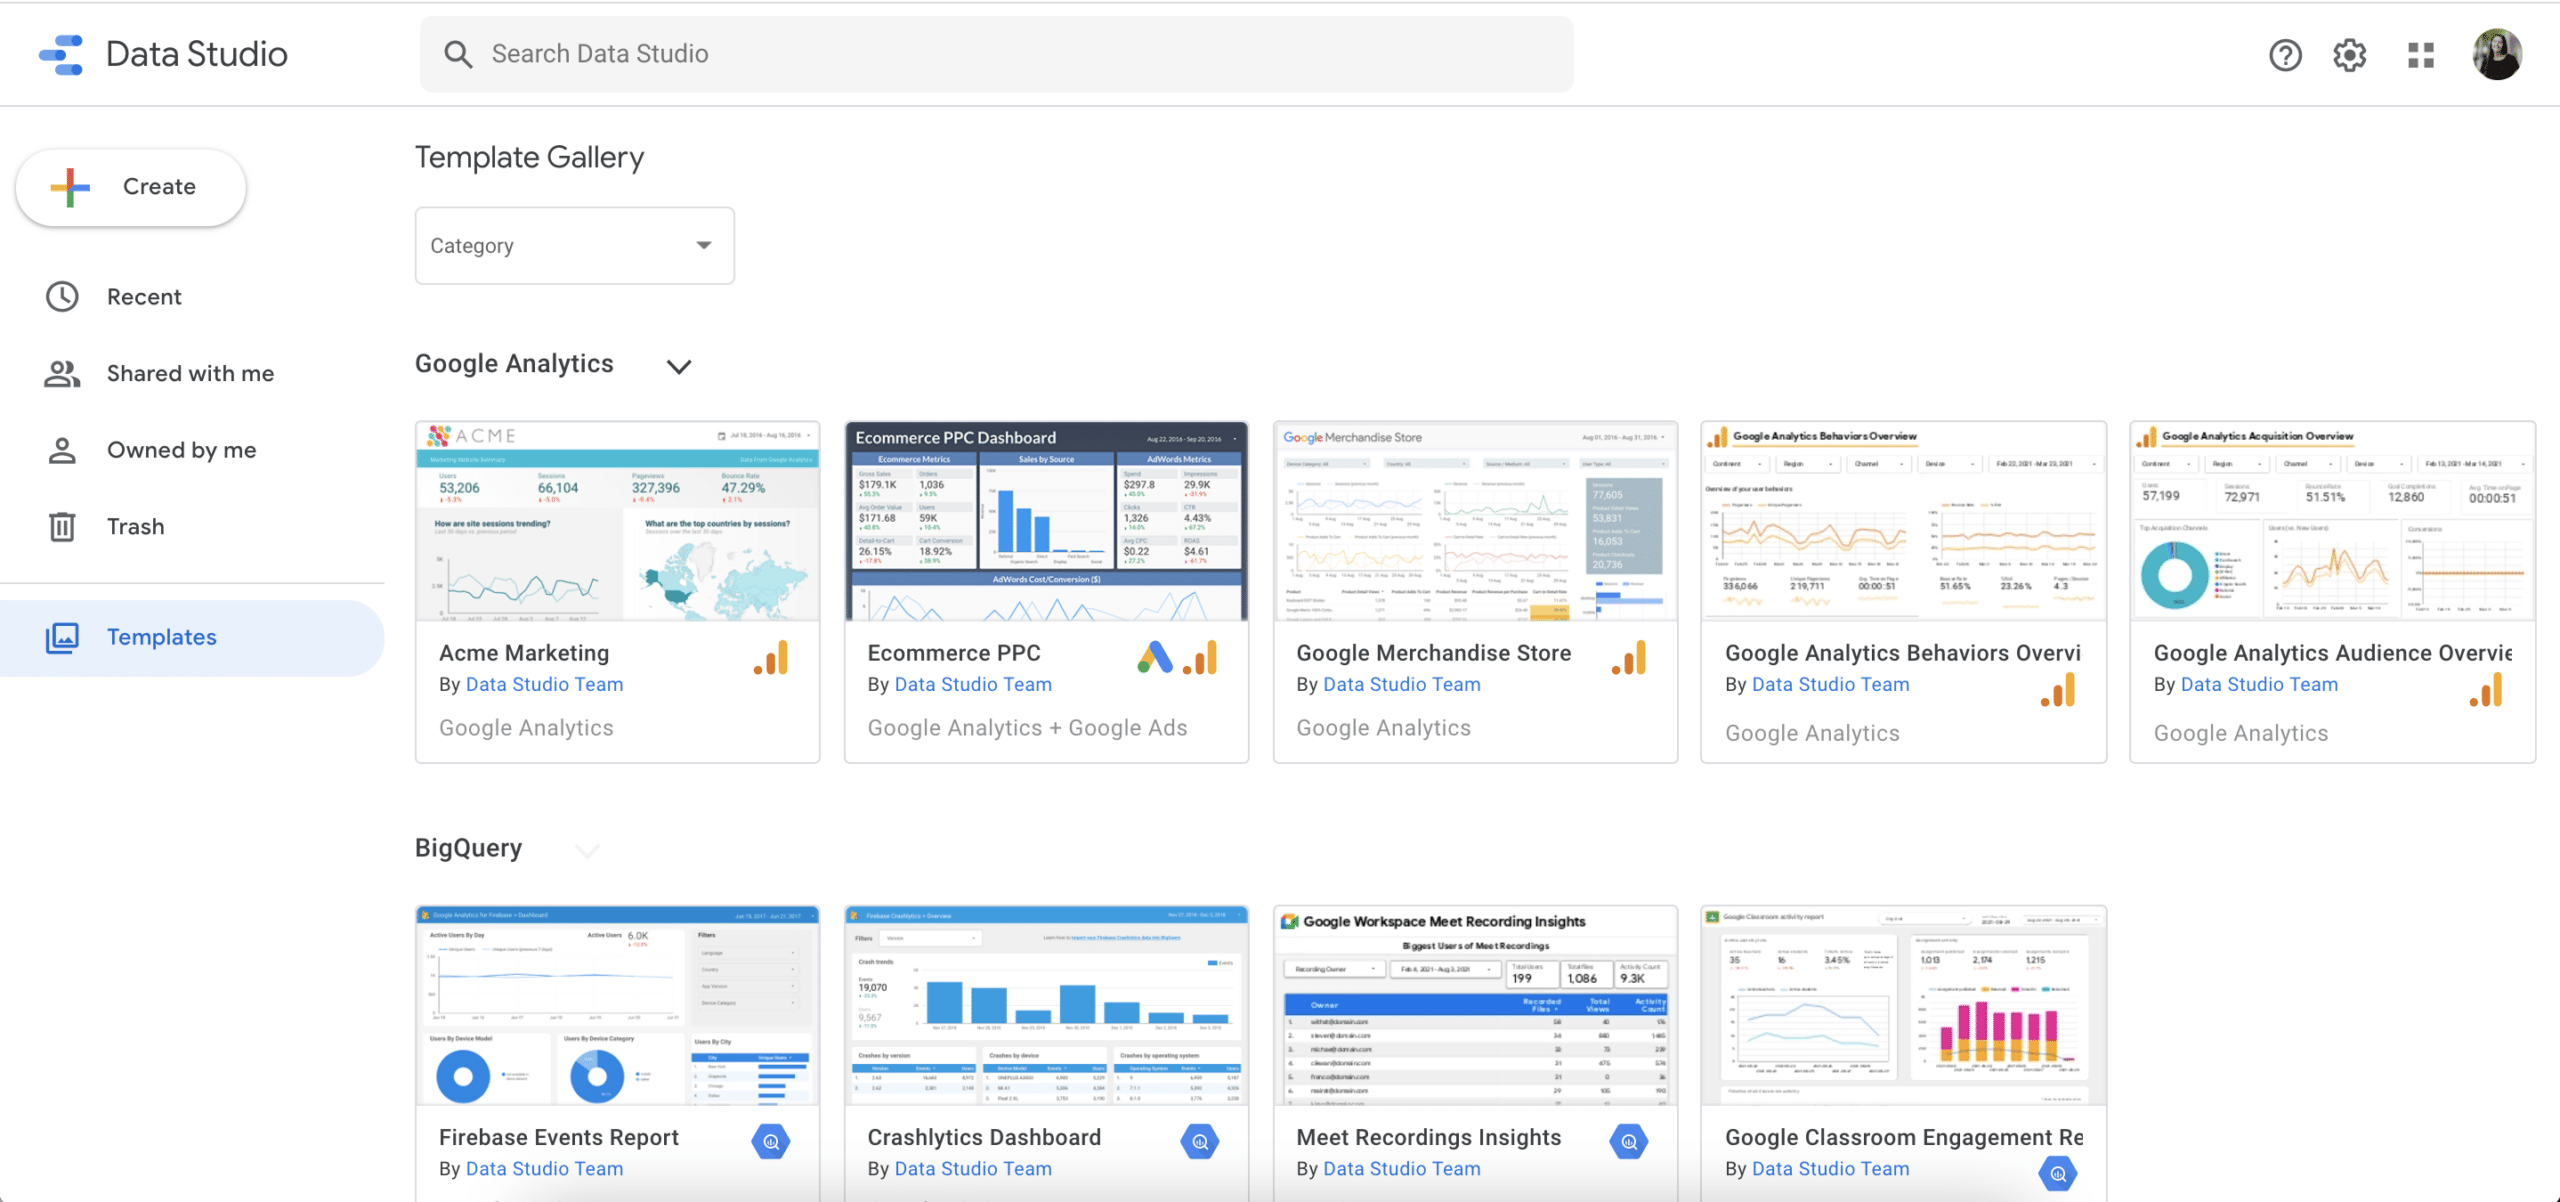
You can even check out the hefty list of Google Data Studio templates, some created by Google and others created by fellow data-gatherers! A lot of the templates have pre-set metric visualizations. These can be especially helpful to play around with as you get used to the tool.
4. Return to the data.
This is the most important step of all. You can’t just set up a beautiful data report and wipe your hands of data altogether! Set a time every month (I like to check in on the first of the following month) to review the data from the previous month.
Do you notice any trends? Is there anything that concerns you? Take note of these and use your findings to make informed decisions about your website.
Have you tried using Google Data Studio before? Share your thoughts and experiences in the comments!