
Rider is a .NET IDE offered by JetBrains. And, like all JetBrains products, it comes packed with powerful features right out of the box. The feature we’ll look at today is the built-in unit test code coverage tool aptly called dotCover. This tool can show how well our unit tests cover our production code and even display right in the code editor which lines have or have not been exercised by a unit test.
Unit Test Coverage
Unit test coverage is a representation of how many statements in the system under test are exercised by the unit tests. The higher the percentage of coverage, the more exhaustive your unit tests are. However, it is important to understand that having a high percentage of coverage is not necessarily an indicator of well-written tests.
Enabling dotCover
Rider comes bundled with the dotCover plugin, but it is not enabled by default. To enable this feature, open the preferences window and go to the plugins section on the left. In the search bar at the top, type in “dotCover” and then click the checkbox on the right. Click “save,” and you will receive a prompt to restart Rider. When Rider restarts, you will have a new button labeled “Unit Test Coverage” on the right-side toolbar.
Running Code Coverage
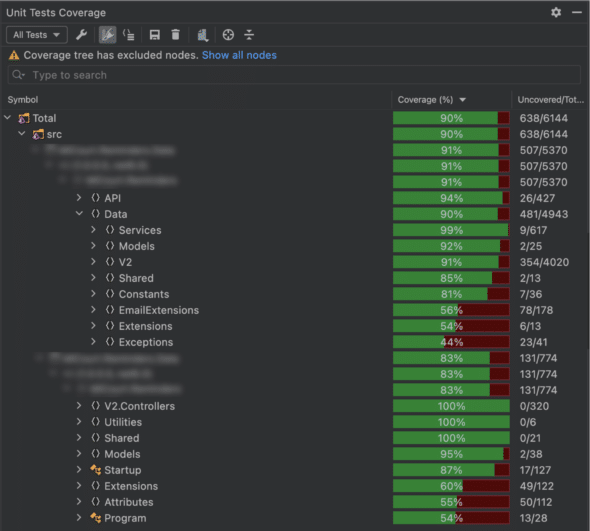
Now that you’ve enabled dotCover, we can run coverage for our solution. Click the “Unit Test Coverage” icon and press “CMD” + “;” + K” to run coverage on your current solution. Your unit test suites will run, and once complete, the “Unit Test Coverage” window will show what percentage of statements were exercised by the unit tests.
Analyzing the Results
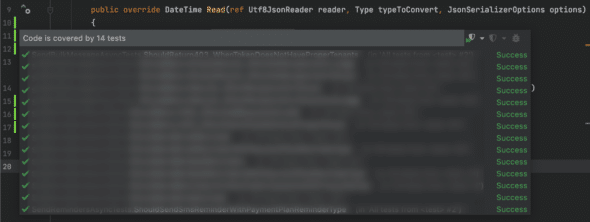
The resulting coverage tree will match the structure of your solution. You can use the carets to navigate further into the coverage tree. By selecting an individual class, function, or property, the results can be viewed line-by-line directly in the editor. In the editor window, green lines next to the line numbers on the left-hand side indicate which statements have been exercised by a unit test. This helps to easily identify missing test cases and improve your coverage.

By clicking the code coverage indicators in the editor window, you can also see which unit tests exercise that specific statement.
Setting an Acceptable Code Coverage Standard for Your Team
While code coverage is not a perfect indicator of a healthy test suite, this tool can help identify areas of potential risk in your solution. Members of the development community have differing opinions on what is an acceptable code coverage percentage. But, the important thing is to understand your results and have standards that work for your specific team.