Uncertainty is inherent to software development — it’s impossible to precisely predict how long individual tasks will take. And that makes it very difficult to manage software projects using traditional project management tools.
Bottom-up estimates and Gantt timelines created before a project starts are helpful for setting initial milestones and budgets. But once development is underway, they can’t help you understand how to map a project’s current status to available options for adjusting the plan. They’re calcified, static — encouraging us to throw blame around during moments of uncertainty and ask questions like “Why did feature x take 3 days instead of the initial estimate of 1.5?” They don’t help teams move forward and adjust their plan.
Burn up charts do. A burn up chart focuses on the future while transparently recording everything that happened from the start of the project until now.
A Little Burn Up Vocabulary
First, there are a couple of Agile software terms you’ll need to understand:
- Product Backlog – A list of prioritized features, tasks, bugs, and milestones driving the dev team’s effort to build a complete product.
- Sprint – A 1- or 2-week repeated period during which the dev team focus on completing a specific set of stories in the backlog (also called an iteration).
- Points Estimate – An integer estimate representing the relative cost (points) required by the dev team to implement a feature, complete a task, or fix a bug in the product backlog.
- Projected Velocity – The likely average number of points which will be completed each sprint calculated based on past team performance.
Anatomy of a Burn Up Chart
At the end of each sprint, the team notes the number of points they completed during that sprint, the velocity for that sprint, and the total points in the project. All of that data (plus the data from previous weeks) generates a burn up chart.

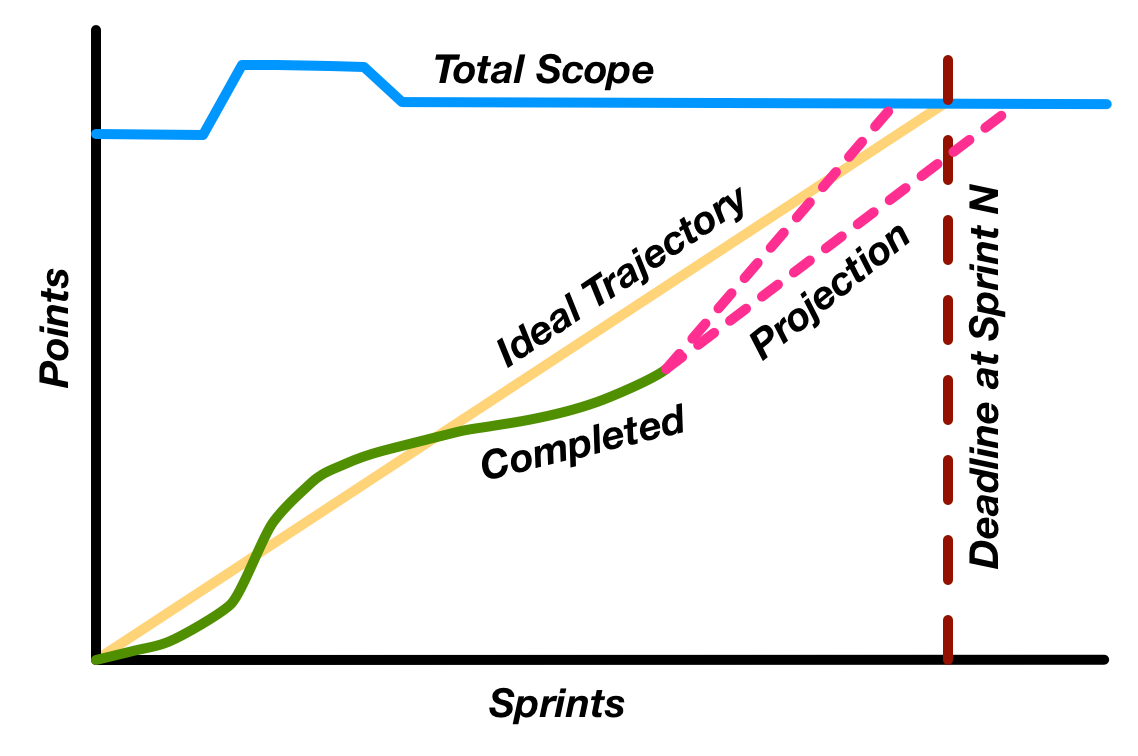
Key:
- Horizontal (X) Axis – Amount of Time (in sprints)
- Vertical (Y) Axis – Amount of Work to be Done (in points)
- Blue Line – Total points; the overall scope of the project over time.
- Green Line – Completed points; the team’s progress towards their goal over time.
- Brown Dotted Line – A budget or calendar deadline.
- Yellow Line – The ideal pace needed to meet the deadline.
- Pink Dotted Line – A high and low projection of likely future progress, based on historical velocity data. (Optional)
Benefits of a Burn Up Chart
Burn up charts highlight the variability in your project and help identify options to adjust the course of your project.
Visualizing Variability
A Burn up chart highlights three key sources of project variability.
- Total scope variability from feature additions and cuts.
- Team velocity variability from inherent uncertainty of feature complexity, interruptions, or burnout.
- Future projection variability, transparently illustrating the range of potential end scenarios given velocity variability.
Adjusting Scope and Budget
Once a team has a few good sprints worth of data recorded, the burn up chart can help visualize the options for adjusting a project plan to keep it on track. If scope is added or the ideal trajectory proves to be unrealistic given actual data, we can illustrate the following options using a burn-up chart:
Reduce scope by X points to preserve budget and calendar deadlines:

Increase budget and extend calendar deadlines to deliver all scope.

The burn-up chart gives our team a clear picture of their progress to a shared goal. When discussing project status with a client, a burn-up chart provides an objective, transparent view into the state of the project and makes critical conversations about plan adjustment easier to start. By visualizing options to adjust their plan, a burn-chart can provide a valuable way for our client to consider a potential adjustment to scope, budget, and/or timeline within the context of the overall project.
Having these conversations early and often will keep the team focused on building the right product without sacrificing value or quality.
Hi Micah, Thanks for the great article. I would like to share this to our QAs in Korea by translating it to Korean. Would it be OK to post the translation on our QA Team blog (http://noogabar.com) with your approval?
This blog is not commercial but a blog for Softward Testing & QA.