Setting Up the Telemetry Pipeline
The setup for this was surprisingly minimal. I chose BetterStack Telemetry to store and surface the logs and metrics. Betterstack was pretty easy to get started with, and their documentation was straightforward. Their free tier gives you three days of log retention and 30 days of metric retention. This was more than enough for me to start understanding my Claude Code usage.
Inside BetterStack, I created a new telemetry source and selected OpenTelemetry as the platform. Once the source was created, I noted the ingestion host and the source token, then dropped the following into my shell profile:
export CLAUDE_CODE_ENABLE_TELEMETRY=1

export OTEL_METRICS_EXPORTER=otlp
export OTEL_LOGS_EXPORTER=otlp

export OTEL_EXPORTER_OTLP_PROTOCOL=http/protobuf

export OTEL_EXPORTER_OTLP_ENDPOINT=https://.betterstackdata.com
export OTEL_EXPORTER_OTLP_HEADERS="Authorization=Bearer "
Now, every time Claude Code launches on my machine, it automatically ships metrics and logs to BetterStack. If you are using Claude Code cloud environments telemetry won’t be captured but anytime the Claude Code agent runs on your machine metrics will be captured.
Building the Dashboard
Once the metrics started flowing into BetterStack, it was time to build something useful out of them. And honestly? This is where I lost some steam. I didn’t want to manually parse the available metrics and figure out the right SQL queries for each chart. Claude Code documents the available metrics and events, but translating that into BetterStack’s dashboard configuration wasn’t how I wanted to spend my next hour, or more 😬. So I did what any self-respecting developer would do in 2026: I let the AI handle it.
I connected the BetterStack MCP server to Claude Code and described what I was looking for in general terms. Then I pointed it at the dashboard I’d started. From there, the LLM used the MCP tools to query BetterStack directly, explored the available log and metric schemas, and then built out the dashboard panels — writing the SQL queries and selecting appropriate visualizations for each dataset. With a few follow-ups prompts, I was able to get the dashboard showing information correctly.
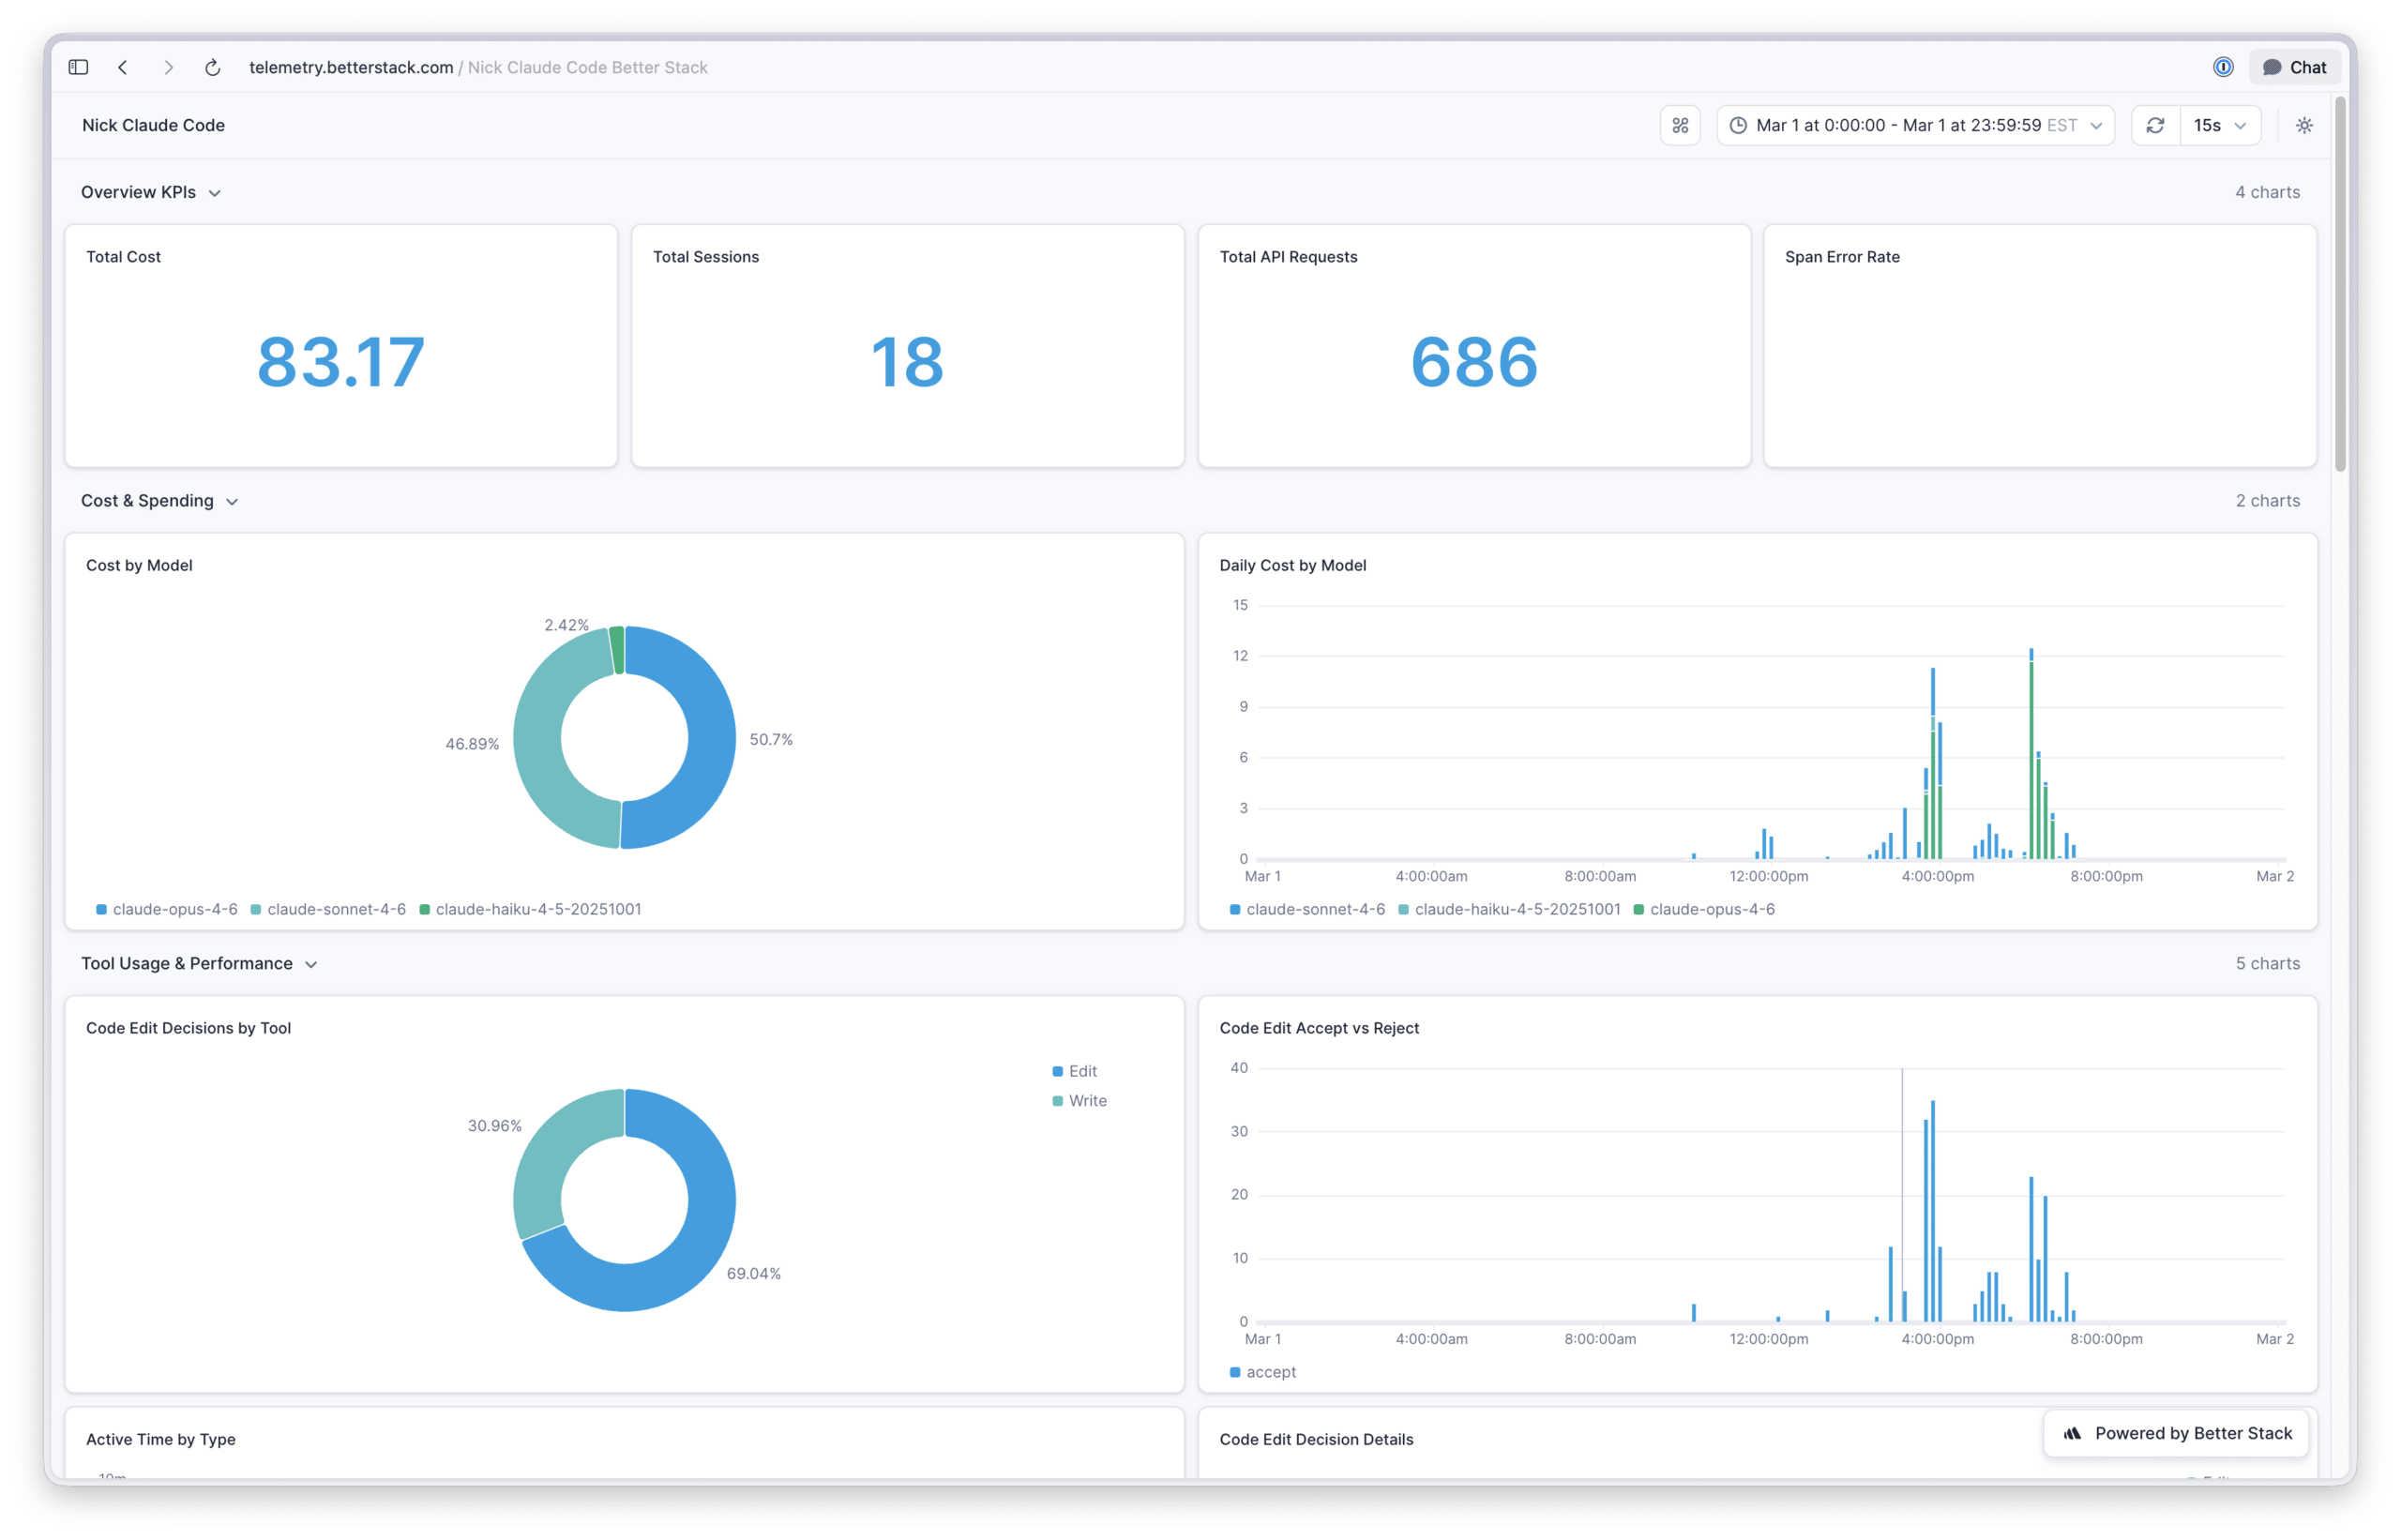
Overview KPIs: Total cost, total sessions, total API requests, and span error rate.
Cost & Spending: Cost breakdown by model and daily cost by model.
Tool Usage & Performance: Code edit decisions by tool, accept vs reject rates over time, active time split between user and AI, edit/no-edit/reject breakdowns, and lines of code added vs. removed.
Token & Cache Efficiency: Daily token usage (input & output), cache hit ratio over time, tokens per model, and daily cache token creation vs reads.
Activity & Engagement: API requests over time, daily sessions, terminal distribution, and Claude Code version usage.
API Performance & Errors:
What the Dashboard Revealed
Claude Code Is a Good Value
Oh my gosh, is a Claude subscription a good value! Based on the token volumes I’ve used in Claude Code, the API costs for my usage are roughly 9x the subscription cost. Granted, API pricing includes a margin over Anthropic’s raw inference costs, so the true subsidy isn’t quite as dramatic. But even accounting for that, Anthropic is clearly incentivizing people to make Claude their default AI platform. Time will tell if this amount of value for price continues, so I plan on enjoying it while we have it.
Subagents Default to Cheaper Models.
When I looked at the model distribution pie chart, Haiku and Sonnet models accounted for about 6% and 5% of my usage, respectively. That was unexpected, given that I use Opus across the board for my work.
After digging in, I found out that Claude Code’s built-in exploration agent defaults to Haiku, and one of my custom agents was still configured to use Sonnet from back when that was the preferred model. Not exactly a groundbreaking discovery, but I’m a sucker for knowing exactly what my tools are doing under the hood.
Token Volume Is Wild.
Over a typical 30-day period, I was seeing over 600 million tokens used by my primary model. My first reaction was skeptical that the chart was calculating something incorrectly; there was no way I was personally generating that kind of input/output volume.
That’s not totally true. The vast majority of those tokens come from . Instead of resending the full context on every turn, Claude Code caches inputs and reads from the cache on subsequent calls. On a particularly active day, I saw 105 million tokens read from cache, compared to only 3 million written to it. You pay a premium upfront to populate the cache, but you make that back many times over as Claude Code continues reading from it through its agentic tool-calling loop. I found this video gives a solid overview of how prompt caching works under the hood and why it’s more cost effective—neat!
Understanding prompt caching matters for two reasons: first, if you’re estimating costs, raw token counts without caching context are misleading, cached reads are significantly cheaper than fresh input tokens. Second, if you’re building on the API but haven’t yet leveraged prompt caching, it’s a good opportunity to help keep your LLM costs in line without needing to move to a cheaper models.
They Ship Constantly.
Over the last thirty days I have tracked, I’ve seen 23 distinct Claude Code releases tracked. The Claude Code team ships code, that’s not in doubt, but as a user, it means the tool you’re using today might behave noticeably differently in a week or two;