Article summary
Recently I ran into a problem creating a dynamic chart in Google Sheets. I wanted to be able to configure the minimum and maximum ranges for a chart dynamically.
Unfortunately, Google Sheets only allows you to statically set the min and max ranges.
I solved the challenge by creating a simple App Script function and App Script Trigger. Here, I’ll share that solution.
Dynamic Charts
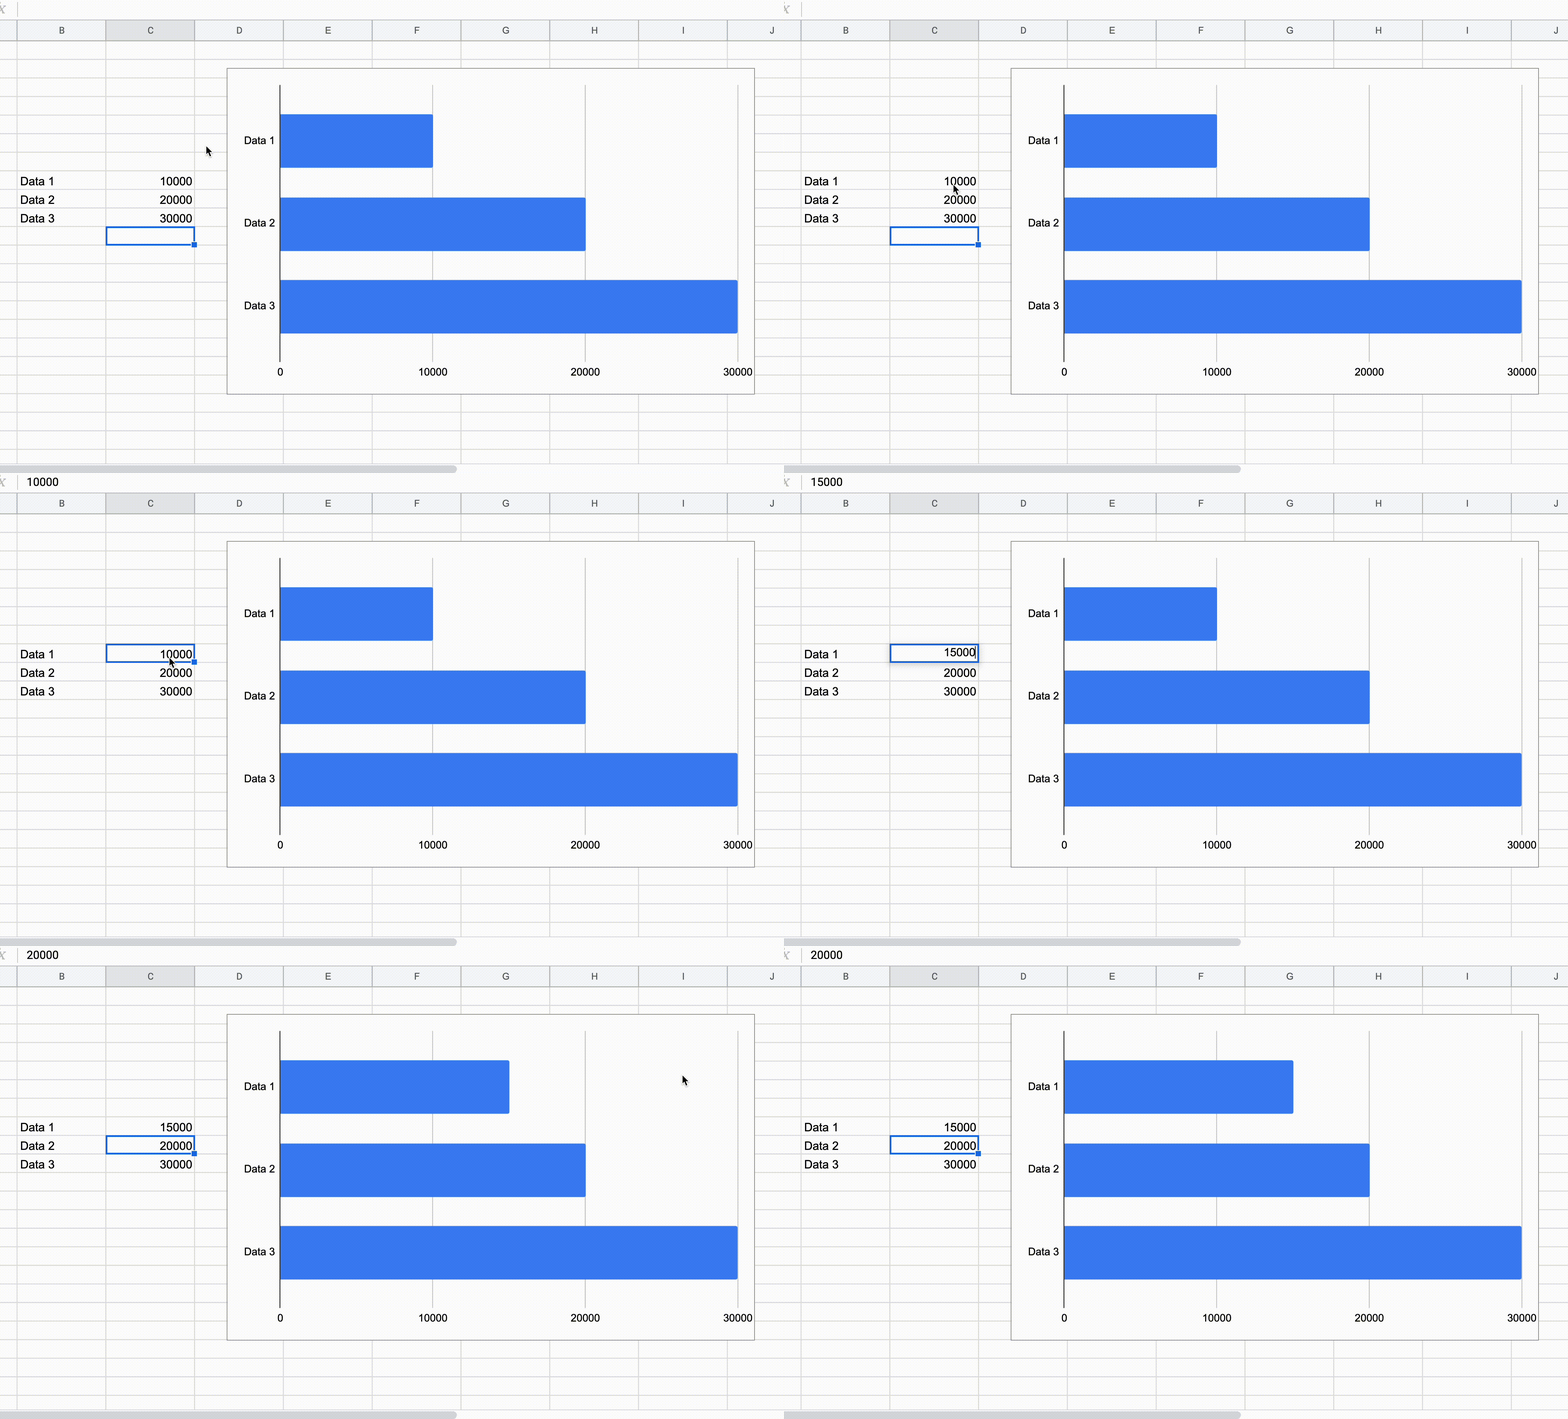
Google Sheets does give you the ability to create dynamic charts. This is very helpful for creating reports because you can reuse an existing chart and simply update the underlying data.
Here’s a simple example:

Unfortunately, Google Sheets doesn’t give you the ability to dynamically set the min and max range of the chart. You can configure the range with the chart, but you can’t change it once you’ve created the chart.
Dynamic Chart Ranges
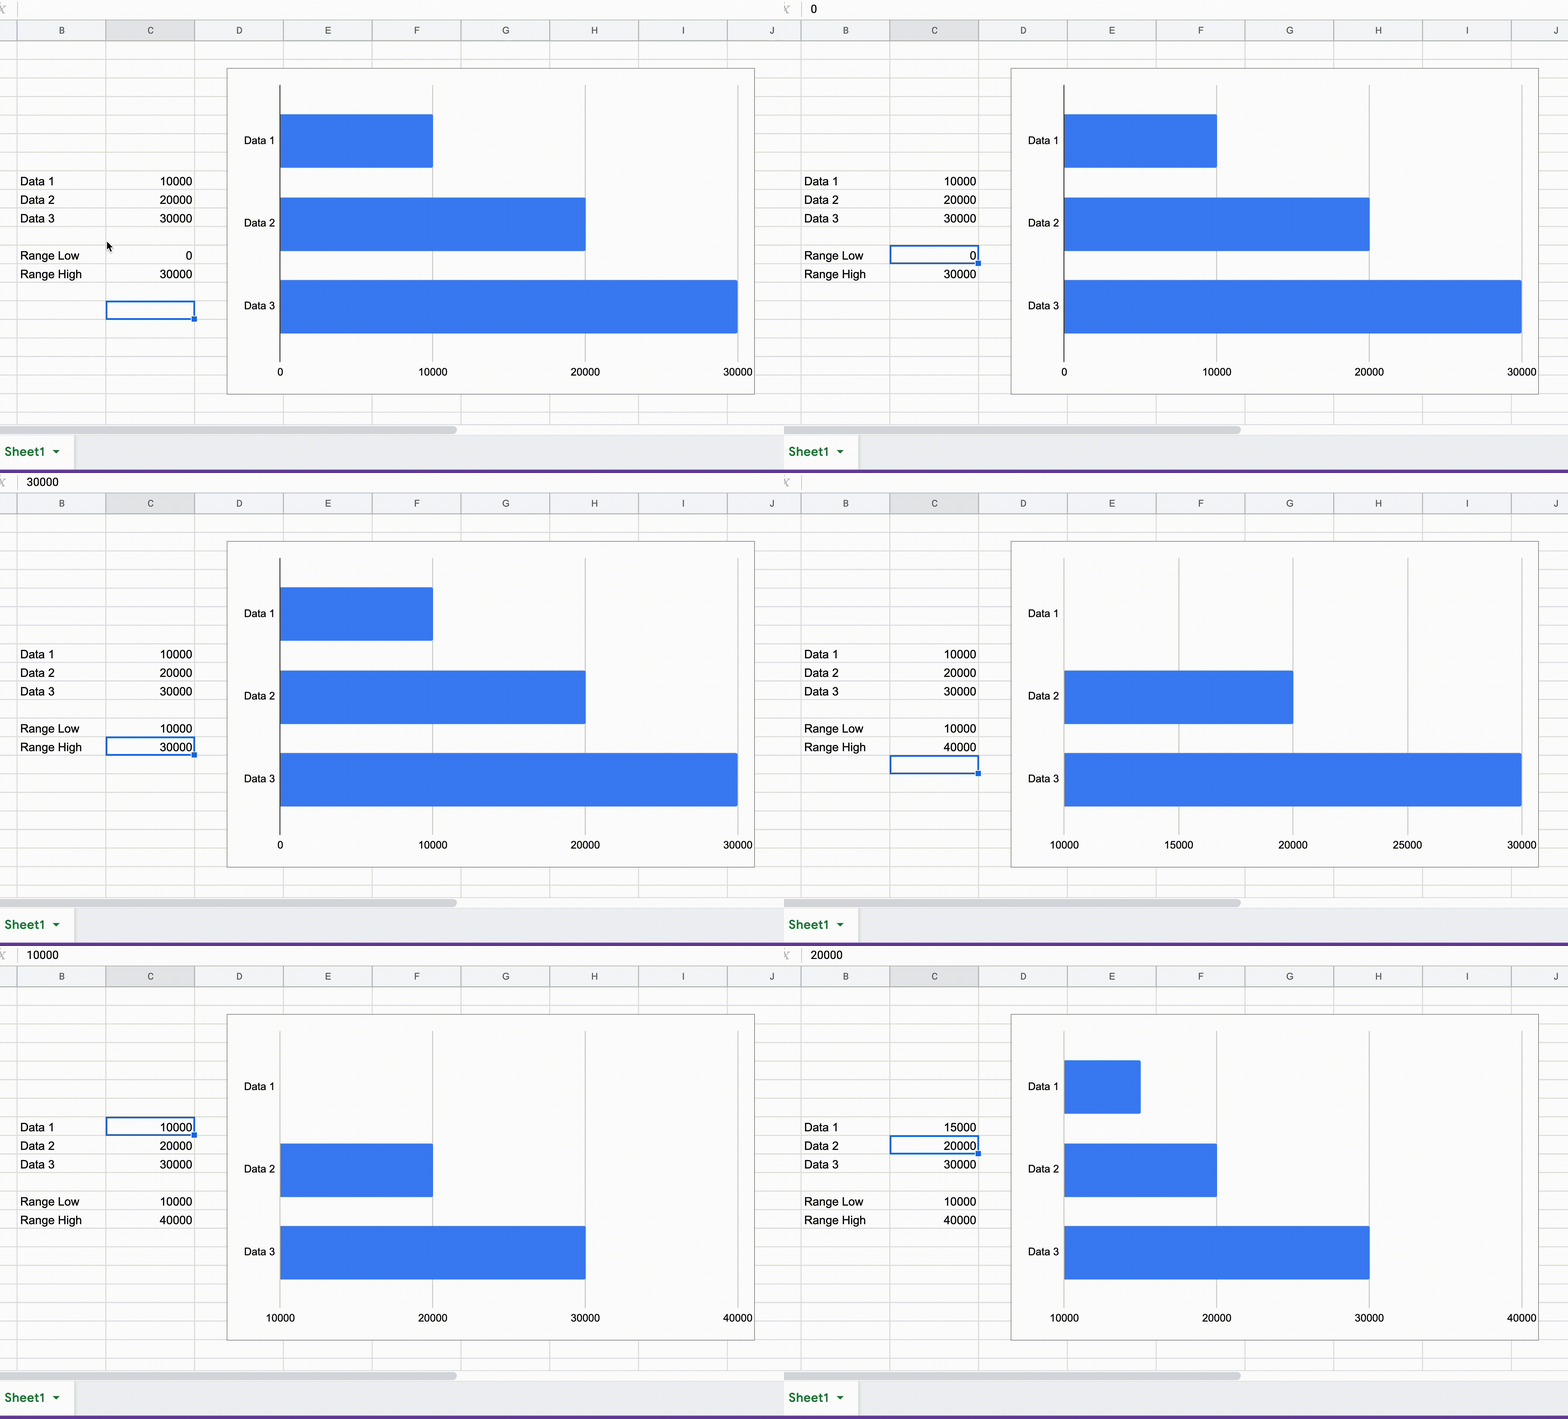
To dynamically change a chart’s range, you need to create an Apps Script function and set a trigger to call that function when something in the sheet changes.
Here’s an example of what I created:

Implementation
1. Create an updateGraphRange App Script function.
function updateGraphRange() {
  var dataSheet = SpreadsheetApp.getActiveSpreadsheet().getSheetByName('Sheet1');
  // update hard coded values for the min/max range
  var min = dataSheet.getRange(12,3).getValue();
  var max = dataSheet.getRange(13,3).getValue();

  var chartSheet = SpreadsheetApp.getActiveSpreadsheet().getSheetByName('Sheet1');
  // customize this if there's more than 1 chart in the sheet
  var chart = chartSheet.getCharts()[0];

  if (min == chart.getOptions().get('hAxis.minValue') && max == chart.getOptions().get('hAxis.maxValue')) {
    // do nothing if nothing changed
    return;
  }

  // https://developers.google.com/apps-script/chart-configuration-options
  chart = chart
      .modify()
      .setOption('hAxis.minValue', min)
      .setOption('hAxis.maxValue', max)
      .build();

  chartSheet.updateChart(chart);
}
This function reads the desired min (low) and max (high) range values from the active sheet. If the range has changed, it modifies the chart to reflect that change.
You can read more about Google App Script here.
2. Create an App Script Trigger that calls the updateGraphRange function “On change”.
This trigger simply calls the function every time the sheet changes.
You can read more about Google App Script Triggers here.

