During the definition and planning phase of our current project, my team generated a lot of written specs. Seventeen feature specs, plus a PRD, a data model, and a handful of supporting reference docs. All of them are in Markdown, all living in the repo. That’s great for handing context back to an AI assistant, but it’s a rough way to actually review anything. Refining a spec meant opening one Markdown file, reading it top to bottom, opening the next one, and trying to hold the whole picture in my head across seventeen tabs.
Doing that more than once got old fast.
So I leveraged AI to build a little tool to make it less painful: a single, self-contained HTML Spec dashboard that lays out every spec in one place, lets me leave comments inline, and hands those comments back to Claude in a format it can act on. It’s lightweight and informal, but it’s made a real difference in how I move through review.
Where the Idea Came From
This original concept was not my idea. A teammate had been using Claude to generate an HTML file that laid out pieces of our documentation in a far more readable format than raw Markdown. It was easier to scan and navigate. The most useful part was that he’d included a place to jot notes about each piece, and a way to copy those notes back out as Markdown that piped cleanly into Claude to make edits. The copied feedback even referenced the specific file you were commenting on, so the assistant knew exactly what to change.
I thought the idea was really useful. It turned “review” from a passive read into something closer to a working session, and it closed the loop between noticing something and acting on it. I wanted to use the same approach for our spec review, but I had a few things I wanted to change.
Making It Regenerable
The most important change I made was turning the whole thing into a Python script.
In the original version, the HTML was generated once. Every time the underlying docs changed, you’d have to pipe everything back into Claude to regenerate the file — which is exactly the kind of manual loop you don’t want during a phase where the docs are changing constantly. So instead of treating the dashboard as a one-off output, I wrote a build script that parses the spec Markdown directly and emits the HTML.
Now the workflow is just: edit the specs, rerun the script, refresh the page. The dashboard is derived entirely from the source Markdown, so it never drifts out of sync with what’s actually in the repo. Adding a new feature spec is as simple as dropping a new Markdown file in the specs folder — no edits to the dashboard itself. It’s a build artifact, so you regenerate it rather than hand-editing it, and it stays current with basically zero effort.
That one change is what made the tool stick. It went from “a nice snapshot” to “the thing I actually keep open while I work.”
The Features I Added
With the regeneration loop in place, I layered on a few things to make the review itself smoother:
- Highlight-to-comment. Select any passage of text on the page, and a comment button appears. The comment gets attached to that exact quote. When I copy my feedback back out, Claude sees both the note and the specific text it’s about. No more “in the third paragraph of the auth flow, where it says…”
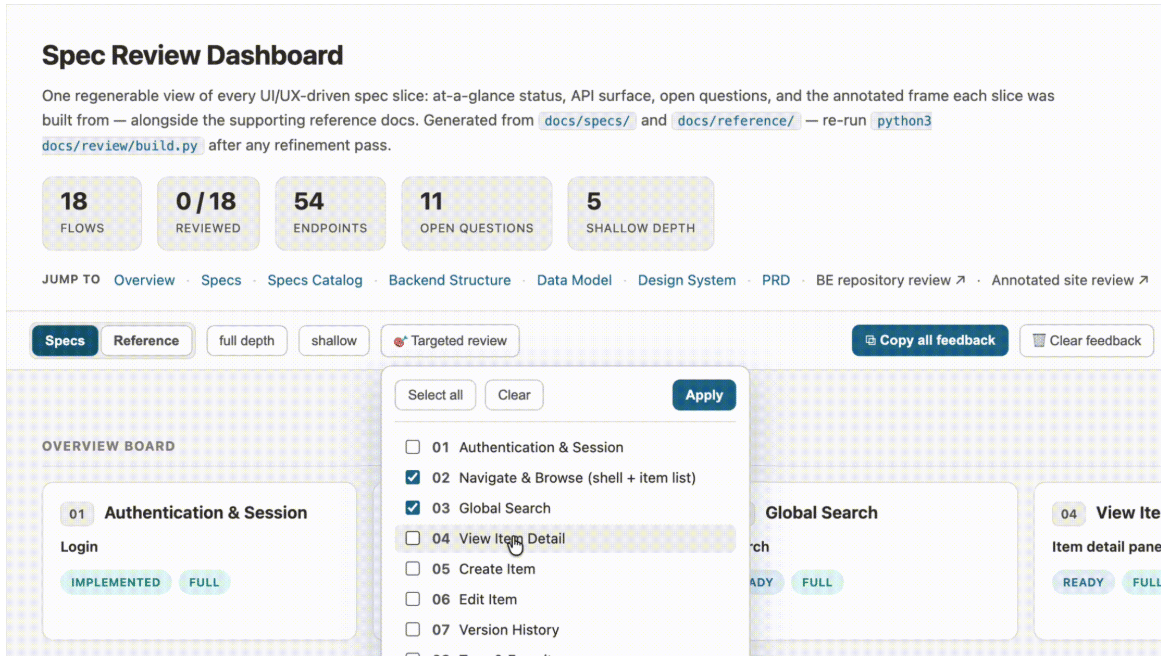
- Targeted review. Seventeen specs are a lot to hold at once, so I added a way to pick a subset to focus on. The overview board, the spec list, and the progress count all narrow to just that selection. When I’m done, one click brings everything back.
- A “reviewed” checkmark on each spec. A small GitHub-style touch: each spec gets a checkbox in its header so I can track what I’ve been through. The header also keeps a running “N of total reviewed” count. I’m a huge fan of making checklists for the satisfaction of checking off the boxes, so this is motivating when I’m working through a big list.
- Image thumbnails. Several specs reference annotated frames and screenshots. Rather than leaving those as file paths I’d have to go dig up, the dashboard pulls them in as a small gallery inside each spec, so the visual context sits right next to the words.
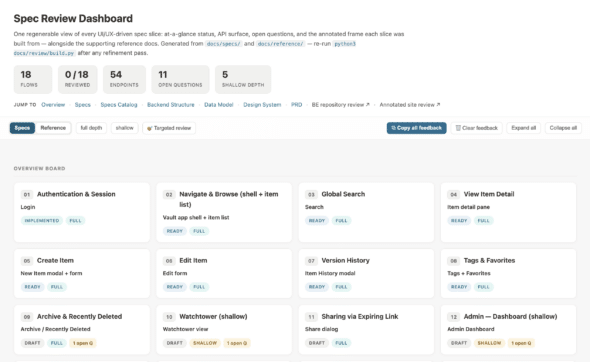
- Overview board with status and open-question badges. Each spec card shows its status, its depth, how many endpoints it touches, and how many open questions are still hanging. At a glance, I can see which specs are in good shape and which ones still need attention.
What I Kept from the Original Idea
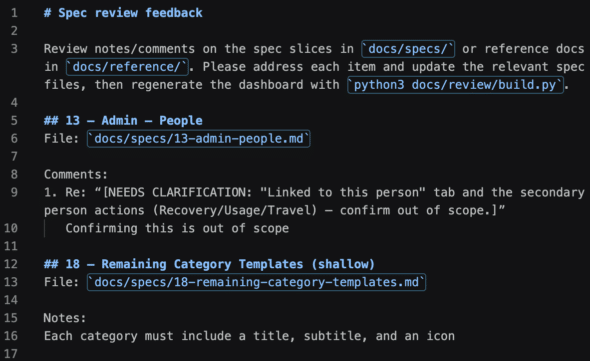
The other piece I kept from the original idea — and leaned on heavily — is the copy-feedback button. Every spec and reference doc has a notes panel pinned to the side, and there’s a button to copy all of it out as Markdown. Each note is tagged by section heading and source file path and topped with an instruction header. That’s the real handoff: I do a review pass, hit copy, paste it into Claude, and get my edits. The browser holds onto feedback between reloads as a convenience, but the copy button is the durable artifact.
HTML Spec Dashboard: Where This Fits
None of this is fancy. It’s a single HTML file generated by a Python script with no dependencies and no remote assets. It opens straight from disk. The simplicity is sort of the point, especially for our two-person team. We’re still iterating on how best to fold AI into the planning and delivery side of our project. A lot of that work is figuring out the small, practical pieces. How do we review AI-generated artifacts efficiently? How do we give feedback in a form that the tools can use, and how do we keep a fast-moving set of documents legible to a human?
A scannable visual board turned out to be a meaningful part of that. It lets me approach reviewing by scanning the board and drilling in where it matters. I don’t have to grind through every file in order. It also keeps the loop between my feedback and the next revision short. It’s a small tool, but it’s earned its place in my workflow. If you find yourself drowning in spec Markdown, it might be worthwhile to build something similar for yourself.