Article summary
graphviz is a great tool for creating quick diagrams. While it does not have a particularly polished WYSIWYG editor such as omnigraffle, it can automatically create diagrams from its simple markup language, DOT. After reading in the DOT markup, it uses various layout algorithms to automatically arrange the diagram. The DOT language is pretty flexible in its formatting and quite easy to generate from other programs.
The main installation includes a couple of standalone programs, such as dot and neato. I’ve mostly used dot, which creates directed graphs. (neato renders undirected graphs.) While installing it is beyond the scope of this post, installation is straightforward on OSX, Windows, and most Linux and BSD distributions.
Creating a Basic Graph in graphviz
To create a basic graph, all you really need is this:
digraph {
    a -> b
}
 That generates the graph shown at right. The nodes ‘a’ and ‘b’ are created automatically, and a directed arc is created between them. To create a PNG diagram, use the command
 dot -Tpng -o OUT.png IN.dot. (Graphviz can create many other formats as well.)
Many attributes can be added to the overall graph, individual nodes and the arcs between them. Here are some example properties
digraph {
    graph [rankdir=LR] // left-right layout, not top-down
    a [shape=square, fontcolor=white, style=filled, fillcolor=blue]
    b [shape=triangle, fontcolor=white, style=filled,
       fillcolor=red, peripheries=3]
    c [style=invis]
    a -> b [style=bold, color=red, label="to b"]
    b -> a [style=dashed, color=blue, label="to a"]
    a -> c [style=dotted, label="?"]
}
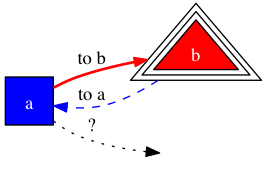 While this can become a bit verbose, the formatting is very consistent, and DOT code can easily be generated. There are language-specific wrappers for creating objects that render to DOT code, but I find the DOT language to be easy enough to work with directly.
Using graphiz for Development
I find graphviz particularly useful for visualizing interdependencies between tasks, diagramming state machines, and debugging data structures.
Here’s DOT code for a task diagram about making a peanut butter and jelly sandwich:
digraph {
    peanut_butter_jelly_time -> make_sandwich
    make_sandwich -> jelly
    make_sandwich -> bread
    make_sandwich -> plate
    peanut_butter -> open_pb_jar
    peanut_butter -> spread_pb
    spread_pb -> clean_knife
    jelly -> open_jelly_jar
    jelly -> spread_jelly
    bread -> grocery_shopping
    grocery_shopping -> fix_bike_tire
    spread_jelly -> clean_knife
    open_jelly_jar -> unstick_jelly_jar
    unstick_jelly_jar -> use_rubber_band_to_grip
    make_sandwich -> peanut_butter
    clean_knife -> unload_dishwasher
    plate -> unload_dishwasher
}
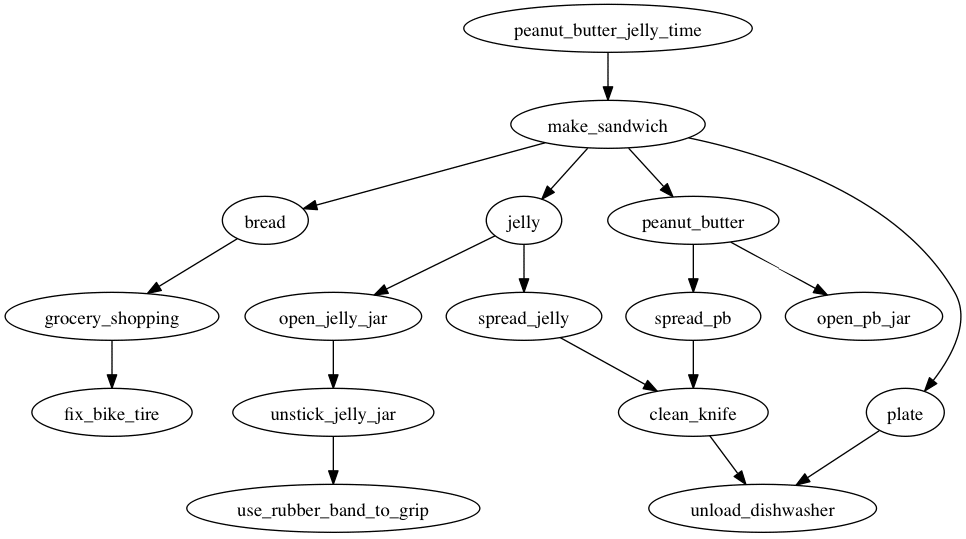
While the order in which the nodes and arcs are specified can affect the overall arrangement, graphviz’s placement algorithms will always cause the nodes without dependencies to sink to the bottom, making it clear what can be acted on immediately.
Likewise, here’s DOT code for a state machine diagram:
digraph {
    START
    offline
    scanning
    joining
    online [peripheries=2]

    START -> offline
    offline -> scanning [label="scan"]
    offline -> offline [label="failed scan"]
    scanning -> joining [label="detected"]
    scanning -> offline [label="failed join"]
    joining -> online [label="handshake"]
    joining -> offline [label="failed handshake"]
    online -> offline [label="timeout"]
}
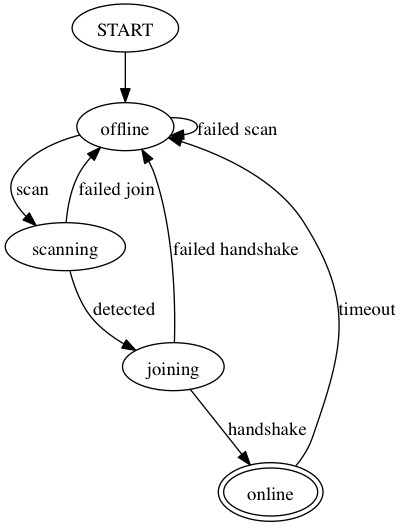
This could be easily generated from a list of states and transitions between them (with labels). ragel, a tool for generating code from state machine descriptions, also uses graphviz for visualizing its output.
Finally, graphviz is helpful for debugging data structures. I’ve found pointer errors in C data structures by writing code to dump out the structs’ addresses and pointers at runtime, making bad references stand out. Structs are best represented by the ‘record’ shape, which allows named sub-fields. Their label is broken up by ‘|’ characters and the fields are tagged with
n16 [label="||||16"];
The sub-fields can be referenced independently: HEAD:f3 -> n16:f3;
For a full example, here is a skiplist diagram I made for my Strange Loop talk.
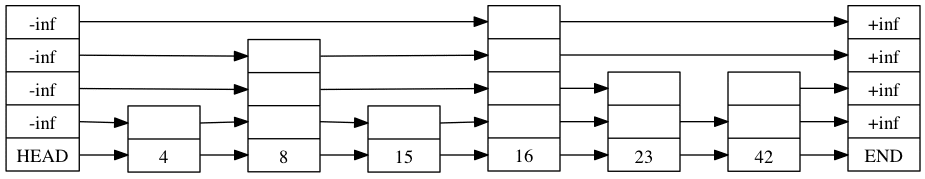
Since DOT is a declarative format, if you want to steer it towards a particular layout, it’s best to work within its model. If you want a series of nodes to appear in a line (as the bottom of the skiplists nodes do), you can modify the weight attribute for the edges between them. This causes the layout algorithm to place higher priority on keeping those nodes as close as the overall layout will allow. Invisible edges and nodes (with style=invis) can also nudge the layout in the right direction.