If you are doing any sort of object-oriented development, you’re bound to reach a point where the number of objects in your codebase is greater than the amount you can keep in your head. Eventually, you will have so many different types of objects (services, managers, service-manager-helpers, etc.) that it gets hard to remember what they all do.
Managers and Services and Monitors, Oh My!
Keeping track of the roles and responsibilities of each class can be difficult, especially if your team does not have naming conventions in place. Is it the Manager that has access to the database, or the Repository? Does this Service need to worry about observing a lifecycle event, or is there some Monitor that it can use?
Without a clear understanding of what each class is responsible for, it can be difficult to write clear unit tests for these classes.
It’s Not That Bad…Is It?
There are plenty of design patterns that can help with this problem. Once you’ve been on a project long enough, you will eventually understand the division of responsibilities between its various objects.
The intricacies about classes will eventually become clear, but what about new team members?
When new people join your team, how do you plan to teach them about these conventions? In order for them to make meaningful contributions, they will need an understanding of the different objects and their specific responsibilities. Sure, you could point them to resources about the Strategy pattern or the Factory method pattern, but that won’t necessarily help them understand what needs to change in order to add a feature to the project.
In these types of situations, I’ve found that it’s best to draw a diagram.
Diagram All the Things!
I recently began pairing with a developer who is new to our project. Before we started writing any code, I gauged his understanding of the feature we were working on. This helped me figure out where to focus when describing the different parts of the codebase that we needed to update.
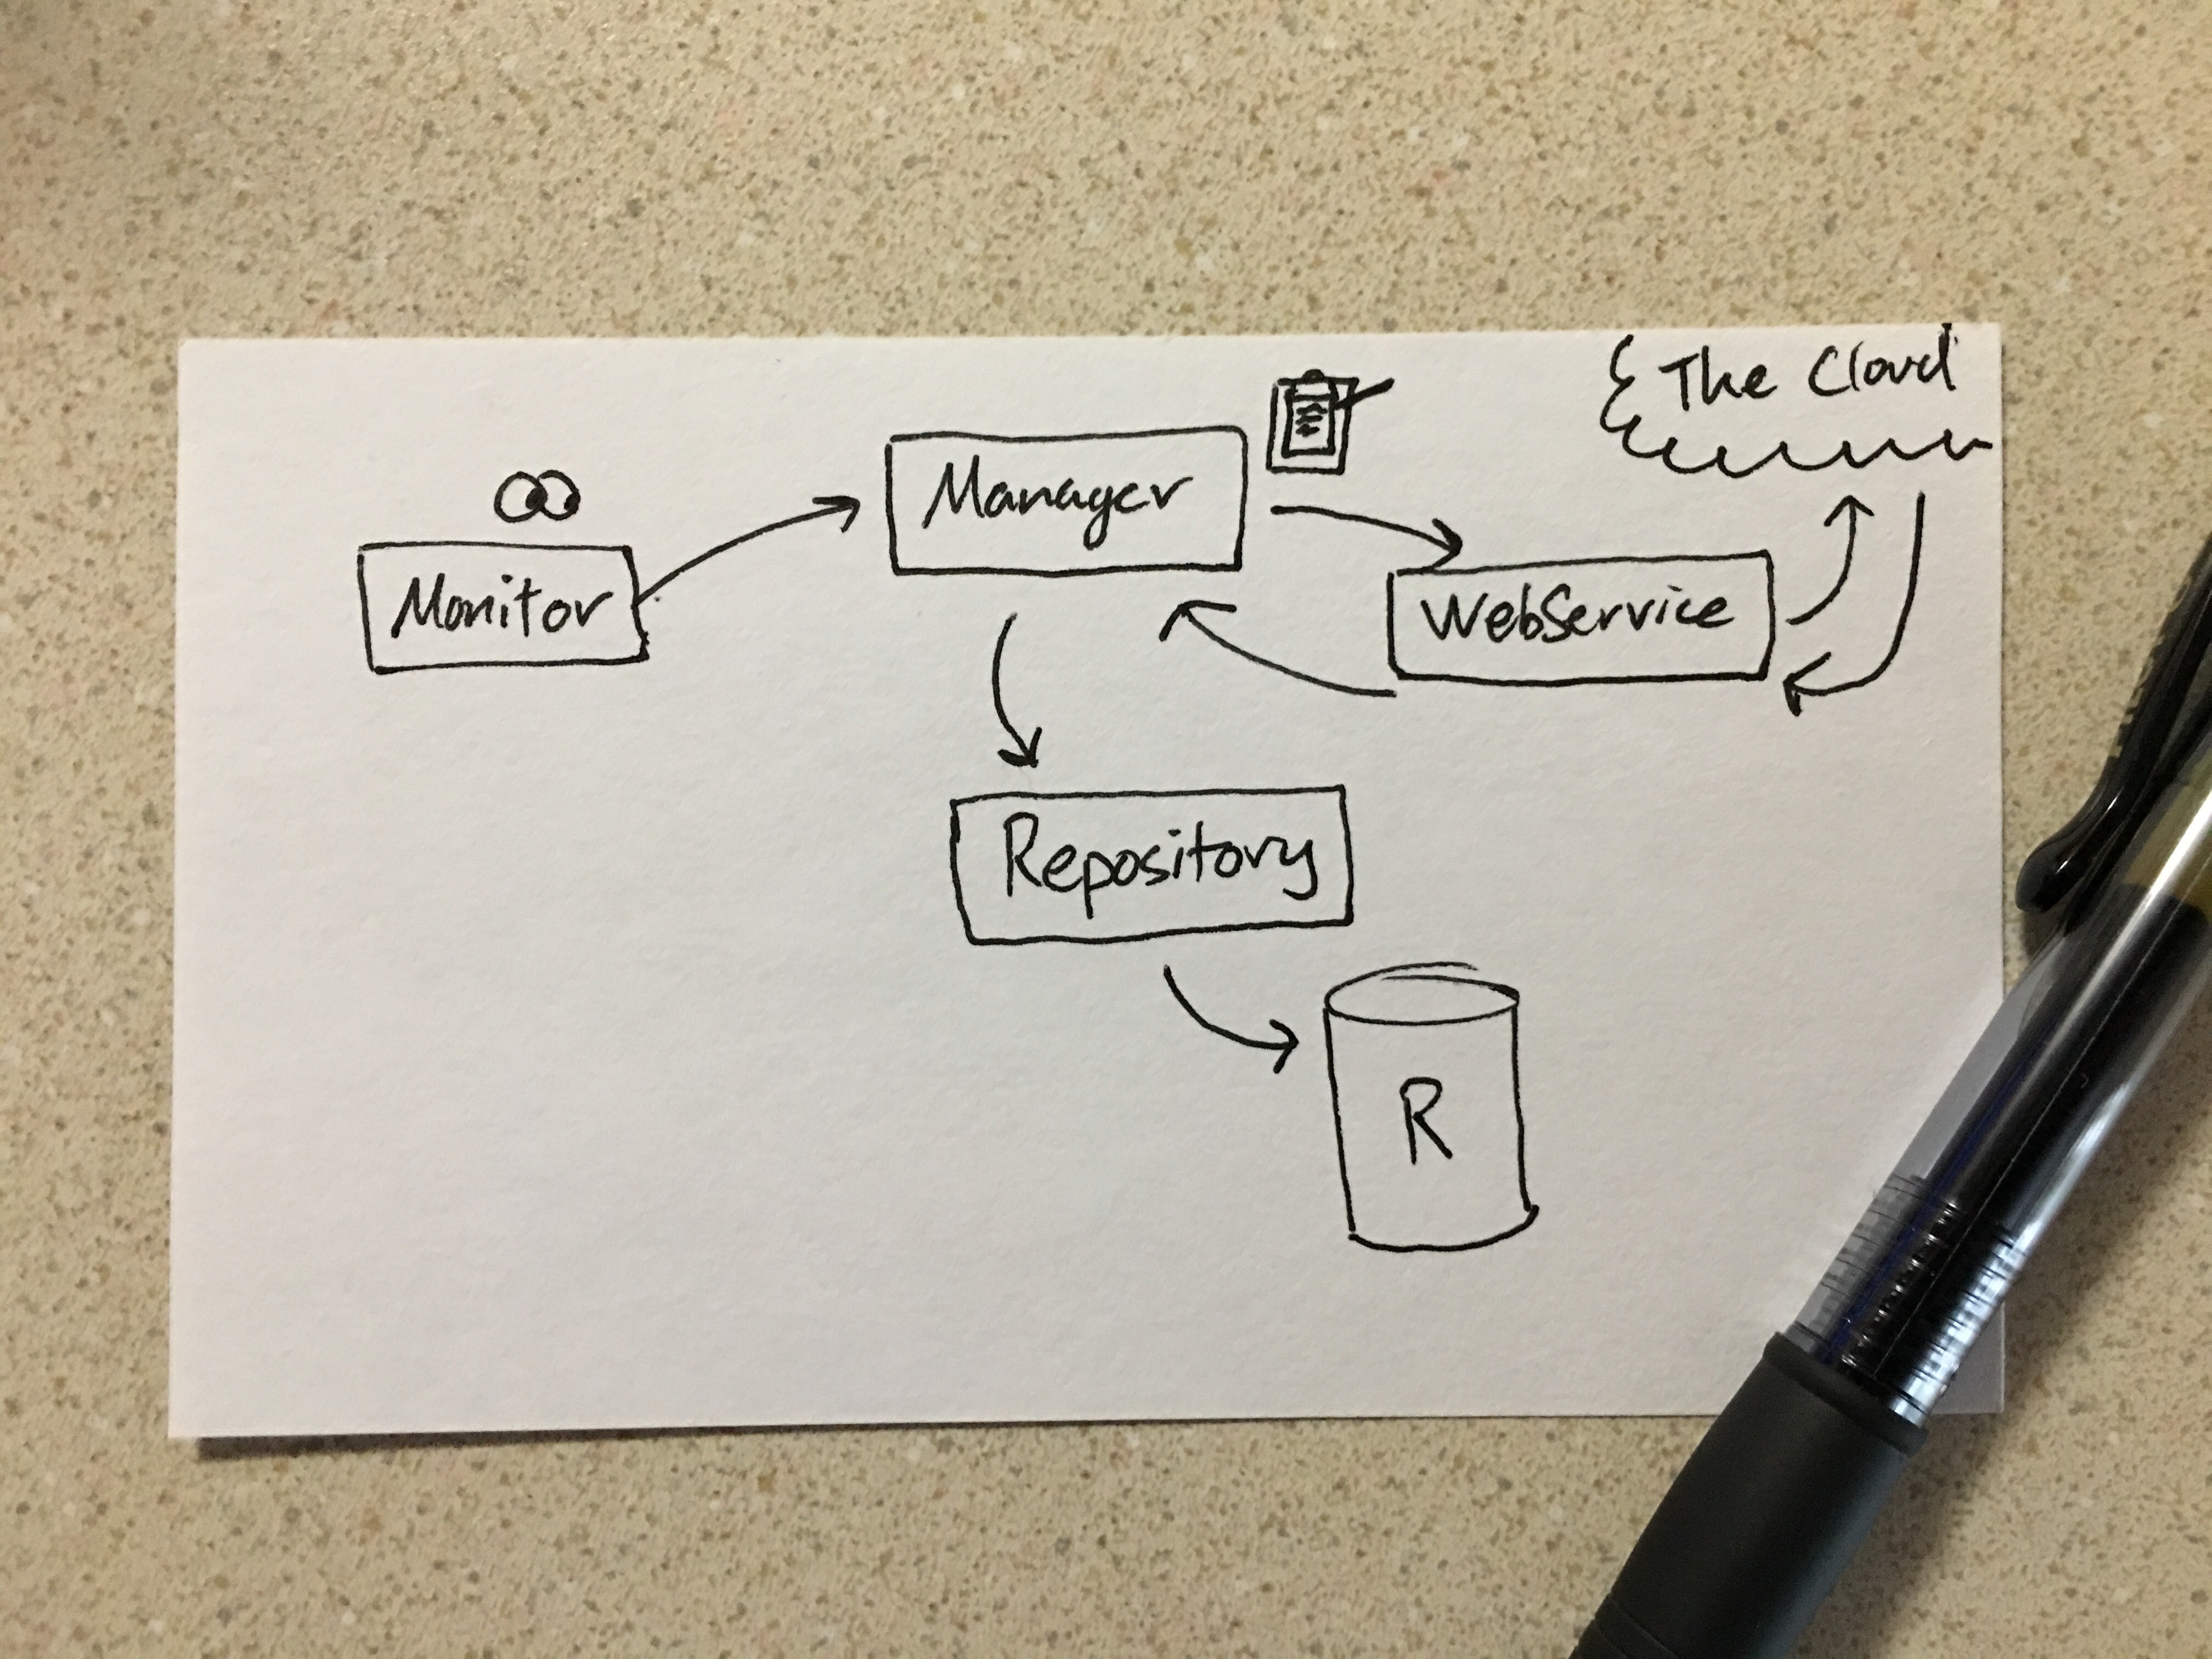
I decided to draw a quick flow chart on an index card to illustrate my description.
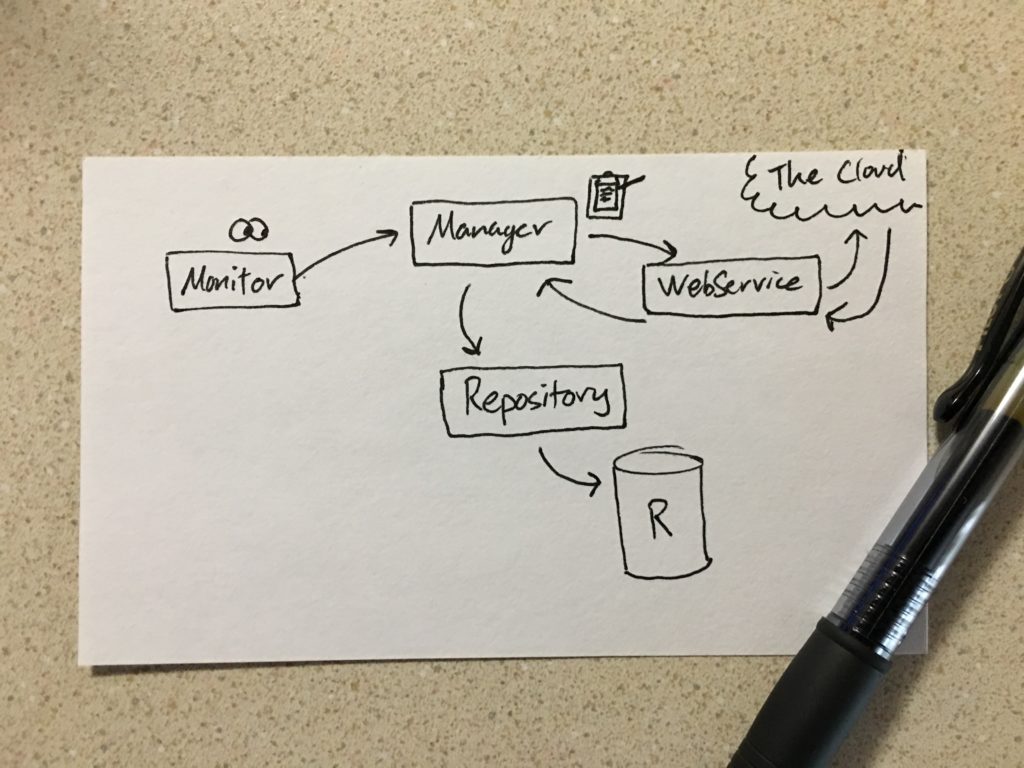
Let’s break down this diagram:
| Class | Responsibilities |
|---|---|
| Monitor | Responsible for observing notifications or lifecycle events and notifying the manager that it happened |
| Manager | Responds to the call from the Monitor and asks the WebService to send or retrieve some data, but doesn’t care how it gets done. It’s also responsible for taking any data retrieved from the WebService and passing it along to the Repository. |
| WebService | Responds to the call from the Manager and sends network requests to “The Cloud” (API). If the network request retrieves data, it will send it back to the Manager to continue processing. |
| Repository | Responds to the call from the Manager and is responsible for reading/writing records to the database. The “R” on the database indicates that it’s a Realm database in the client. |
Highlighting each of the objects helped make their responsibilities clear, so testing the classes became simple and straightforward. These levels of abstraction allowed us to easily mock dependencies as needed to test different branches of execution.
At any given point during our work on this feature, we could refer to this diagram to see what still needed to be completed. It gave us a shared understanding of the system architecture, and it made the pairing process quite efficient. Even after the feature is done, the diagram can be useful as documentation, perhaps with a slightly higher fidelity.
I found the process of creating a diagram that highlights the responsibilities of the different parts of a system very helpful, and I plan on continuing this practice moving forward.
What sorts of onboarding strategies do you use to help new team members learn about your codebase?