Article summary
Have you ever wanted to quickly chart some data without coercing it into a spreadsheet? Perhaps you even want to do something mildly complex, like differentiate the data based on some facet that isn’t being charted, or have the ability to interact with multiple visualizations at once? Vega-Lite provides a lot more power than spreadsheets and is generally easier to work with.
What is Vega-Lite?
Vega-Lite has been around for quite a while. It belongs to a class of tools, like Jupyter, more commonly used for scientific and research purposes. Its website describes Vega-Lite as “a high-level grammar of interactive graphics.” More concretely, I think of it as a tool for quickly visualizing and interacting with data.
To build your visualizations, you describe them in fairly straightforward JSON data. Take a quick look at Vega-Lite’s excellent examples page to get a sense for the scope of what’s possible.
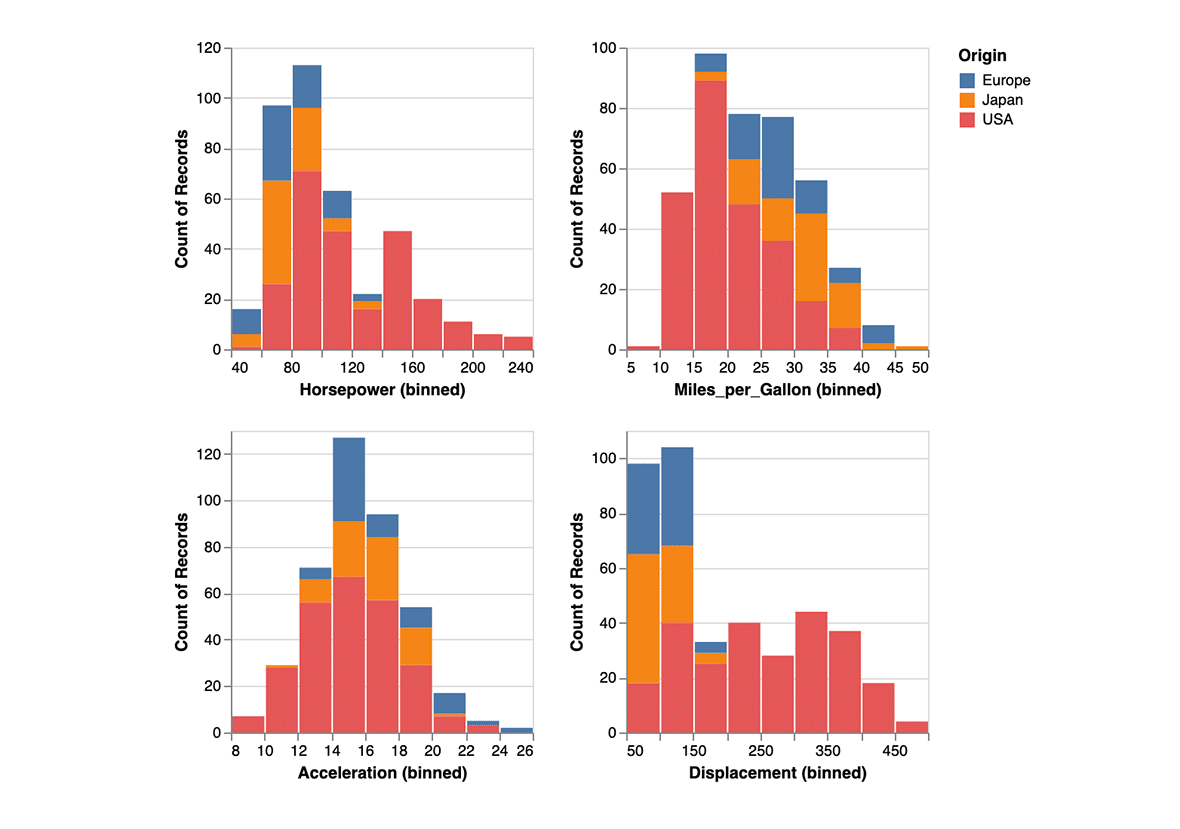
In this example (shown above), they’ve used fewer than 20 lines of JSON to draw four histograms that illustrate the spread of different facets of the same set of cars. Importantly, the JSON is very declarative: it describes what you’d like to see rather than precisely how to accomplish it.
Vega-Lite has GitHub integration, which makes it easy to share your graphics while allowing viewers to interact with the data and how it’s displayed.
What about D3?
In the past, teams at Atomic have had success using D3 to build visualizations into the software we create for our clients. Given that, it’s tempting to compare the two. If Vega-Lite is so helpful, does that make it a candidate for replacing D3?
I think the answer is no.
D3 provides a JavaScript API for transforming data and binding data to the DOM. It’s more work to produce the same visualizations that Vega-Lite could offer, but the end result is more coupled to the browser and allows for much more customization.
The lower-level API of D3 makes it possible to create visualizations that you couldn’t accomplish with Vega-Lite, and with far greater control over aesthetics and interactivity.
When Would I Use Vega-Lite?
Keeping in mind that Atomic builds custom software, where do I expect that I’ll find uses for Vega-Lite in the future?
One example scenario is creating an interpretation of analytics data, logs, or the data that lives within the system. Vega-Lite makes it very easy to visualize this kind of data. As much as I love spreadsheets, I’m often disappointed or frustrated in their charting features. Frankly, JSON is much easier to deal with than spreadsheet GUIs.
There are libraries that make it possible to render Vega-Lite charts in, e.g., React applications. If I find myself wanting to include charts in a web app where the speed of implementation is more important than custom visual design, I also might reach for Vega-Lite. I suspect a good candidate would be an interface designed for a system administrator.
However, if it’s essential to have control over the details of the visualization’s design, or if you need user interaction or live-updating in response to new data, I’d probably reach for D3 or another tool.
Conclusion
What I’m really excited about with Vega-Lite is how much easier it is to interpret and visualize data than using a spreadsheet. The learning curve is quite minimal, and the comprehensive examples that they provide are a great way to see what’s possible with it and learn on the fly.