I’ve been doing a lot of Node.js development lately. I wanted to get a better understanding of the debug options available for Node apps, so I thought I would do some investigation and summarize what I found.
Option 1: The Built-In Debugger
If you’ve done any Node development, you’re probably familiar with the built-in Node debugger. It supports placing debugger statements in your source code. When you run your app in debug mode via node debug [your app], it will break when a debugger statement is hit.
As an example, consider the following simple Node app:
for(var i=0; i<5; i++){
  debugger;
  console.log(i);
}
console.log("done");
If we run this app via node debug app.js,it will break when the code hits the debugger line (shown below).
break in app.js:3
  1
  2 for(var i=0; i<5; i++){
> 3   debugger;
  4   console.log(i);
  5 }
From here, we can use the following debug commands (found in the Node debugger docs) to step through our code :
continue – cont, c
step – next, n
step in – step, s
step out – out, o
At any point, we can open a REPL by typing repl to inspect or reassign variable values.
In my experience, I’ve found the REPL to be a bit slow at times. It occasionally hangs when inspecting especially large variables.
Option 2: Node Inspector
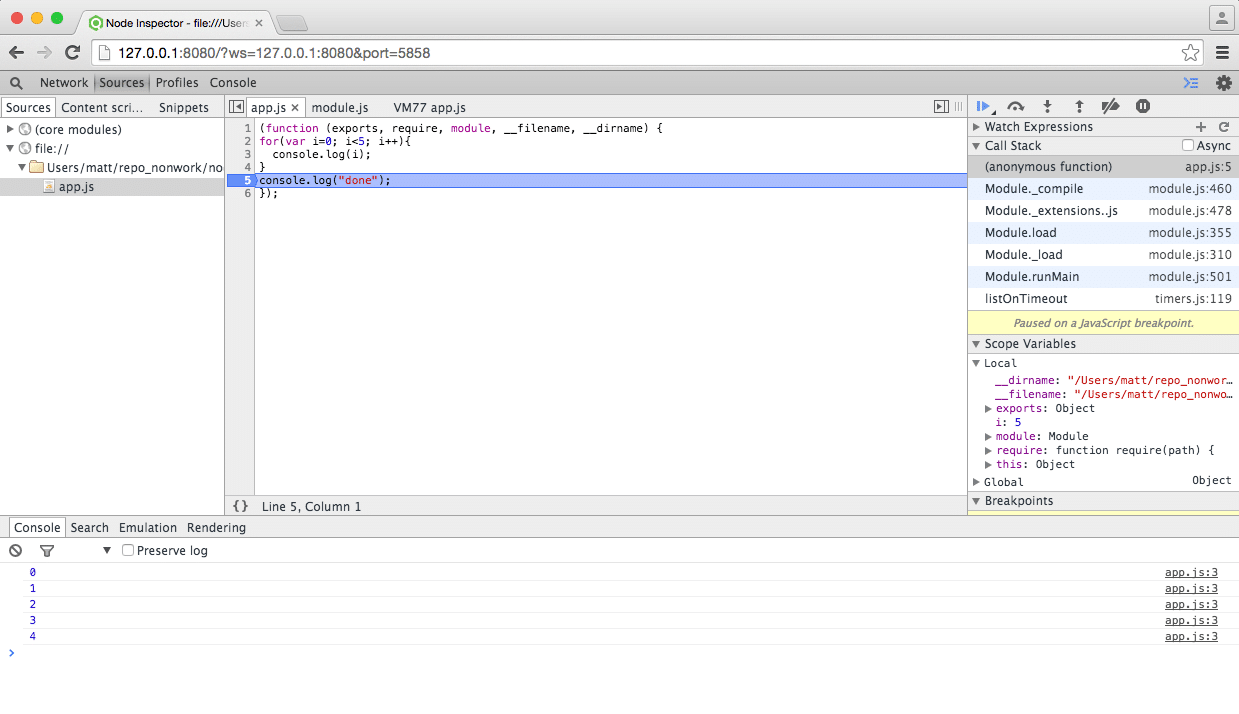
The built-in debugger works fine in some situations, but it takes a far back seat to Node Inspector. Node Inspector allows you to debug your app using a nice GUI debug interface inside of a browser. It currently only works in Chrome and Opera. If you’re familiar with the Chrome Developer Tools, Node Inspector will look familiar to you–the interface is identical.
Let’s look at an example. Consider the same simple Node app that we discussed above, but without the debugger command inserted into the source code.
for(var i=0; i<5; i++){
  console.log(i);
}
console.log("done");
To use Node Inspector to debug, you’ll need to install it from NPM via:
npm install -g node-inspector
Once installed, we can use it to run our Node app by typing:
node-debug app.js
You should see output that looks something like this:
Node Inspector is now available from http://127.0.0.1:8080/?ws=127.0.0.1:8080&port=5858
Debugging `app.js`

Debugger listening on port 5858
It may open up Chrome (assuming it’s set as your default browser) and immediately bring up your app. If it doesn’t do that, simply navigate to the address from the console output (http://127.0.0.1:8080/?ws=127.0.0.1:8080&port=5858 in our example). Doing so results in a nice visual debug environment.
You can browse your source code and set breakpoints just as you would when debugging client-side JavaScript.
Option 3: IDE Debuggers
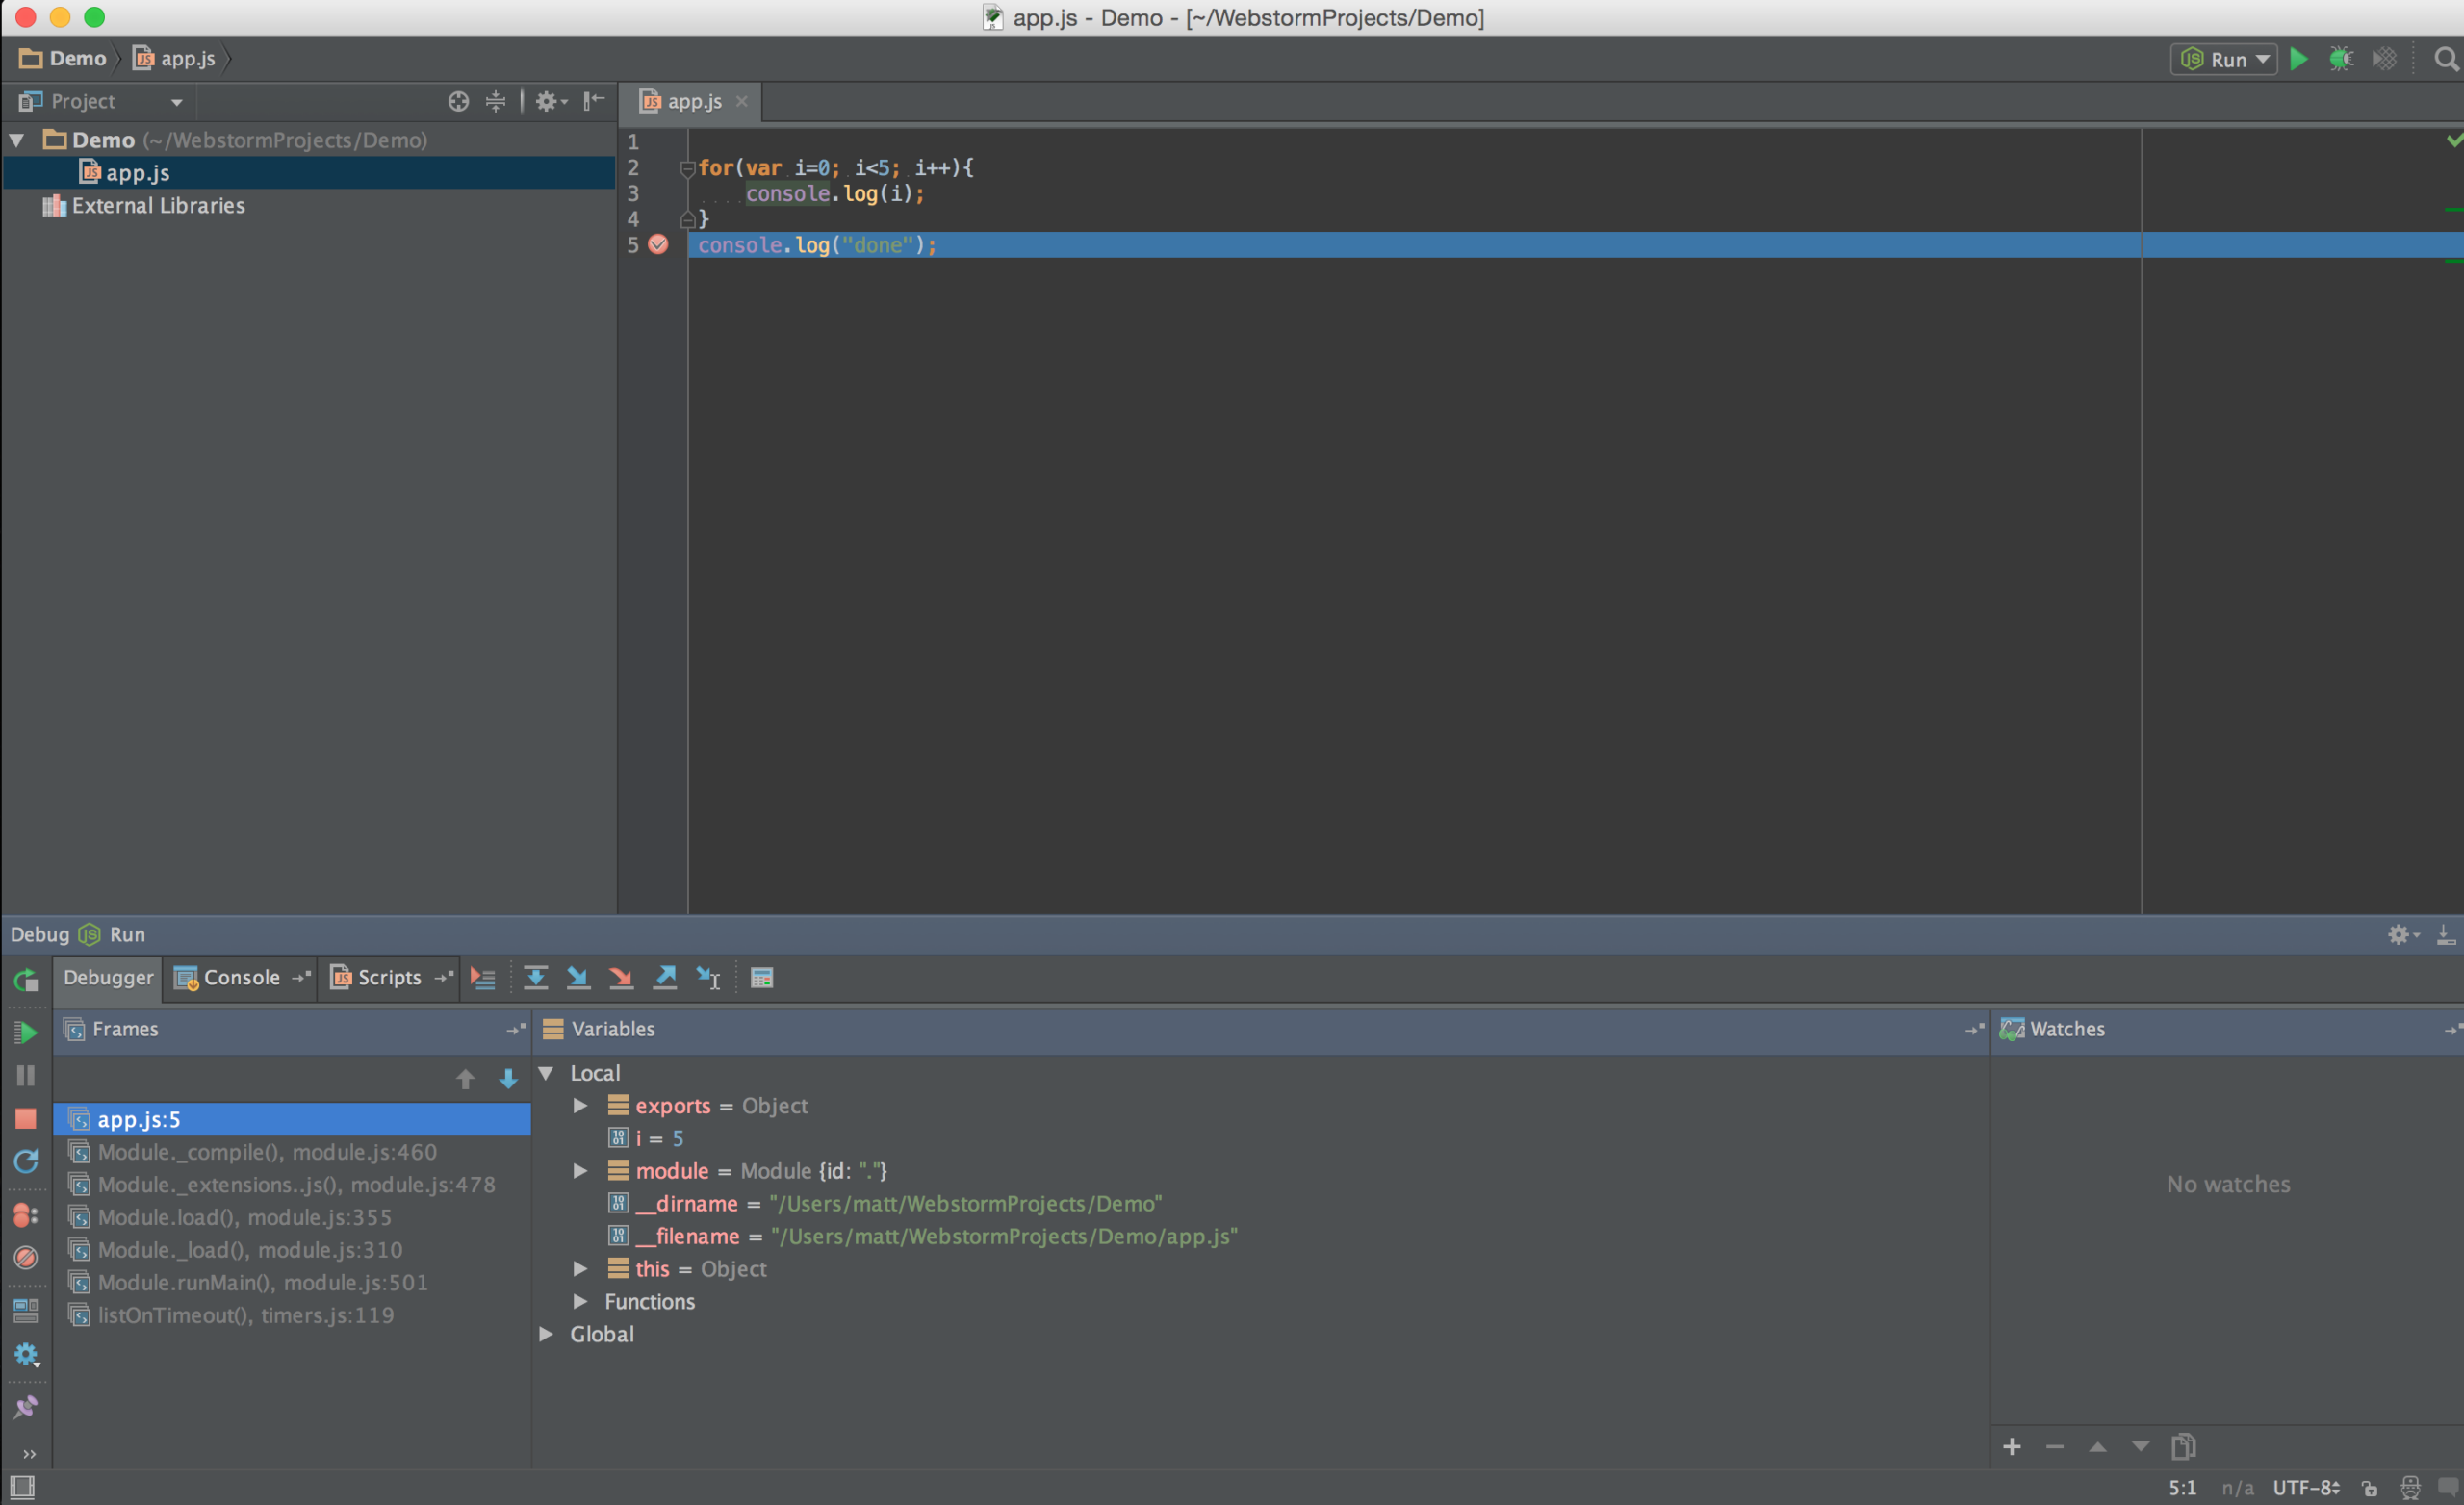
Another way to get access to a nice Node debug environment is to use an IDE, such as Web Storm. The Web Storm integrated debugger is excellent. After setting up your project in Web Storm, you can just run it and debug as you would with any other IDE. I’ve included a sample screenshot below.
That sums up my investigation. What’s your favorite method for debugging Node apps?


I’ve heard that the editor ‘Brackets’ with the plugin ‘Theseus’ has pretty good debugging.
I am coming to NodeJs from Groovy Land, I used IntellijIdea so now using webStorm same development experience, nice to see the alternate method of debugging.
We only use WebStorm (well Intellij in our case)
I don’t know why would anyone use anything else.
one node you may need to add –nolazy in WebStorm to prevent skipping of async calls
we use: node-dev –debug-brk –harmony –nolazy ./your_script.js
Regards,
Sean – ( node powered DigitalSignage FREE http://DigitalSignage.com )
Thanks for your article: compact and well explain!
Option #4: ironNode https://github.com/s-a/iron-node
I’d be interested to know how you/people debug when using babel for es6 and es7. For es5 Webstorm is great but it’s a horrible mess ( at least how I’m doing it ) when you are running babel.
R
You should try node-inspector + sourcemap.
You missed iron-node
https://github.com/s-a/iron-node
2 other IDEs to consider from Microsoft are Code (cross platform host) and the nodejstools for the venerable Visual Studio (Windows host, but remote debug possible)
I have used the Microsoft IDE and it does well.
I recently tried Visual Studio Code by Microsoft and liked it more than any other debugging options
The best debugger for nodejs application, among I have seen. Doesn’t take as long as node-inspector to startup, Debugging with IDE interface are highlights.
line debugger: come on, I’ve got work to do. Even in the 80s I had an interactive debugger.
node-inspector: unreliable. dropped connections, to much to do to run it.
web storm: can’t debug with npm link. slow. forces you to use an IDE.
bottom like. node debugging sucks.
@henrick Rather than whining about it, why don’t you work on something to make it better?
Thanks for sharing your findings! I’ve tried the nodeclipse (in eclipse IDE) and it does well too.
I’ll also take a look on iron-node
With node-inspector, after executing node-debug app.js, I see the debug screen open up in Chrome (great!). I can click on the play button in the upper right (it says ‘resume script execution F8’ when I hover). But, after the application is running, I can’t figure out how to display it in a browser. I’d like to set a breakpoint in my routing code and then click in the user interface on what should trigger that route. So, my question: how can I view my application in a browser when I am debugging?
Tested multiple debugging options, including: Atom, Brackets, MS VS Code, LightTable, Node-Inspector.
While not the fastest, Node-Inspector proved to work as debugger and quick editor, even remotely(slow but usable).
I use: node-debug –save-live-edit –no-preload SomeApp.js
It opens a browser and pauses execution.
You must run the app or use a flag to prevent stopping.
You must display you own app in another tab or browser.
Node-Inspector has no way of knowing where you UI code starts,
I’m trying to do a lot of development in the browser, to prevent the server from doing too much work, that would only make the app feel slower.
There is no way Node-Inspector (or any debugger) could guess where my server homepage is located.
But if you want some client-side debugging(without using the browser’s debugger), Adobe Brackets is supposed to be able to do that nicely.
Bessie – I’m trying to figure out the same thing. Have you found out any solution for that ?
MS VSCode is the easiest and fastest node debugger I have used. I used to use Webstorm but the debugger is painfully slow. Node-inspector always seemed clunky to me.
Although VSCode has the best debugger set up – I don’t like it as an editor – so I switch back and forth between VSCode and Atom.
After more testing, I found Node-Inspector to be too slow, dropping connections is annoying so I switched to IronNode which is nice.
For remote debugging, VNC over SSH seemed the fastest and most stable option, with a minimalist desktop installation. Remote X server using MobaXTerm or similar seems too slow.
Will test VS Code’s Debugger some more to see how it compares to IronNode.
IronNode has one clear advantage, using the same debugger for client side code and Node is painless. The disadvantage is that I sometimes find myself fixing code in the debugger but not being able to save it directly.
you may want to use my plugin for atom https://atom.io/themes/atom-bugs
vscode is the best
use vscode
use vscode
try this https://atom.io/packages/atom-bugs
works perfectly and it’s UI is quite simple and effective :)
Yeah, +1 for Visual Studio Code.
In newer versions of node, the inspector is included and node-inspect no longer works. Run:
node –inspect app.js
More info – https://github.com/node-inspector/node-inspector/issues/907
1. Browser-based debugging of Node.js scripts is now a built-in feature, circa 2016/2017
2. Invoke debugging from the command-line (–debug-brk pauses execution at top of file)
$ node –inspect –debug-brk ./myApp.js
3. Automatically open the debug session in Chrome via an extension: NIM (Node Inspector Manager), which monitors a port and hostname you specify-
https://chrome.google.com/webstore/detail/nim-node-inspector-manage/gnhhdgbaldcilmgcpfddgdbkhjohddkj?hl=en