I recently decided to use Node.js for my current project, and I also thought it would be a good idea to start off using ES6 (properly known as ECMAScript 2015). ES6 was a major addition to the language, and it was just formalized in June 2015. Since then, there has been a lot of effort to add ES6 compatibility to browsers (and Node.js). Until there is unanimous support for ES6, which will likely be quite some time yet, developers who use ES6 are required to run their code through a transpiler in order to transform it into valid ES5 for browser compatibility.
One of the first questions I asked myself was, “How am I going to debug this in Node?” So, as all good developers do, I started with a Google search. This search returned a blog post that Matt, a fellow Atom, wrote last year. I really liked this post–it was short, sweet, and to the point. The problem was that the examples used vanilla JavaScript, and no transpiling was needed. Just running node <filename>.js will not work if Node doesn’t support the syntax!
Luckily, as is typically the case, smart people have already thought of this and found some good solutions. I’m going to use the same three Node debugging techniques that Matt provided, but modified to work with ES6.
But First… Babel
The key to understanding these examples is to first gain a basic understanding of Babel. Babel is, simply put, a JavaScript transpiler. It is the de-facto transpiler used basically everywhere in the JavaScript community, and if you’re going to work in ES6 (or pretty much any other language that you want to compile to JavaScript), Babel is your friend. This post is not specifically about learning Babel, but I would recommend reading through the docs to get a basic understanding.
Option 1: The Built-In Debugger
Let’s take the example from the aforementioned post, but modify it with some ES6 syntax:
import { _ } from 'lodash';

let print = i => {
  debugger;
  console.log(i);
}

_.times(5, i => print(i));

print("done");
If you try to run this with Node, you’ll see something like this:
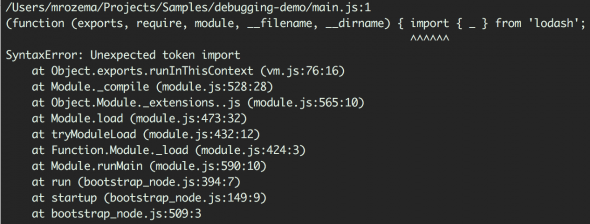
This is because the new import syntax is not yet supported by Node. A nice way to run this code is with babel-node. babel-node will first transpile the code and then run it. So, all it takes is babel-node debug <your app>, and we are now able to use the built-in Node debugger just as we did before. You can install babel-node with the babel-cli NPM package.
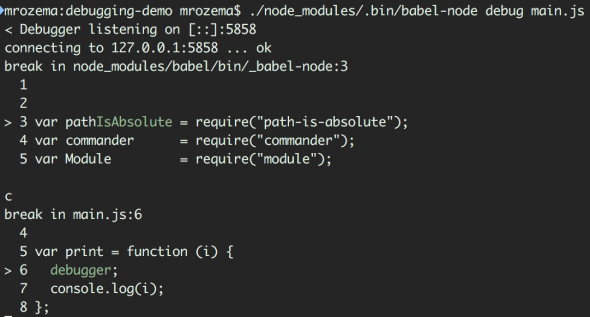
Notice how the print function looks different now than it did in the source. This is because Babel transpiled it prior to running Node. For a simple application, this is fine, but it can be really confusing in a bigger application–it sometimes feels like you’re debugging someone else’s code (because you are).
Option 2: Node Inspector
As Matt mentioned in his post, the built-in debugger is fine for basic situations, but it’s nothing compared to node-inspector, which uses a CLI called node-debug. If you try to run node-debug against this ES6 code, you’ll get the same error as before. Luckily, there’s a Babel extension to fix this: babel-node-debug, which adequately describes itself as “node-debug but with babel-node”. You can install this package with npm install -g babel-node-debug.
You will also need the es2015 Babel plugin (npm install -g babel-preset-es2015). Then, run this command to start the debugger: babel-node-debug main.js --presets es2015
You can also add the presets in a .babelrc file in the working directory (this is the preferred method). When you run babel-node-debug <your file>, it will launch Chrome (assuming it’s your default browser), and sometimes it will automatically navigate to https://127.0.0.1:8080/?port=5858 for you. If it doesn’t, just navigate there yourself. Once the debug window starts, Babel will start transpiling your code, and the debugger will hit a breakpoint right when your transpiled program is about to run.
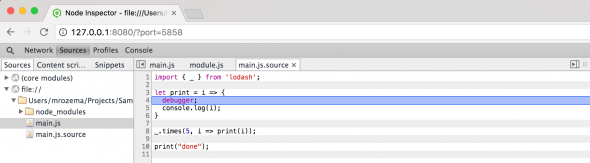
Notice that the debugger is paused in my ES6 code! Now we’re talking! This is done with a Babel feature called source mapping. Learn more about that here.
Option 3: IDE Debuggers
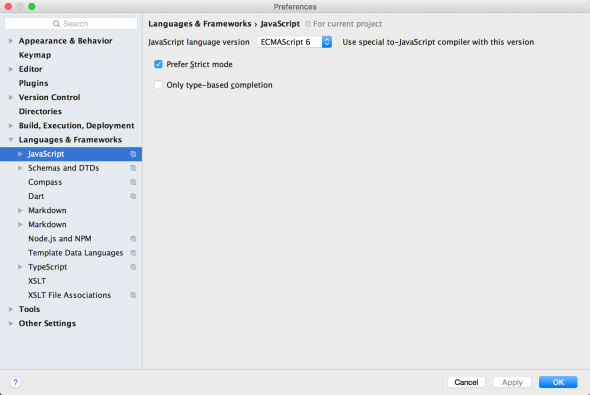
Debugging in an IDE such as WebStorm is mostly the same as before. There are two steps to get this working in WebStorm:
- Set up WebStorm so it can handle ES6:
- Point the debug configuration at
babel-noderather than just plain-old-Node:
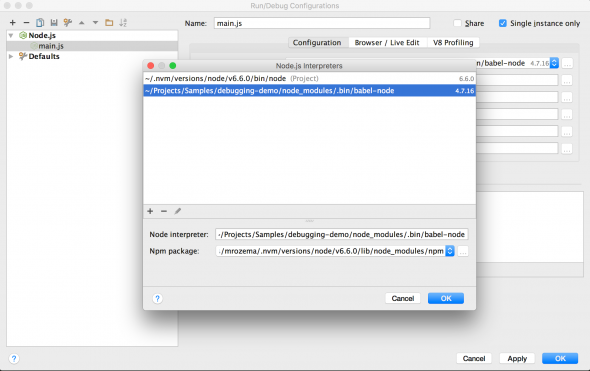
Once you’ve configured those changes, you can debug your code in WebStorm just as expected!
So there you go–an ES6 debugging experience that’s equivalent with Node! What other debugging techniques have you used to debug an ES6 Node.js application?
I usually use VSCode + source map with babel register at index.js like this https://medium.com/@katopz/how-to-debug-es6-nodejs-with-vscode-8d00bd6c4f94#.8p4m3re74
For option #3, instead of pointing to babel-node, add ‘-r babel-register’ to ‘Node parameters’ also work.
Hi Matt,
Thanks for your article, it’s great and really useful. Now, I am wondering: is there any IDE that allows to debug ES6 code bypassing transpilation? Let’s say that I am using Node.js on the server side or for an Electron desktop application, and don’t care about transpiling code at all. Is there a way to debug ES6 directly?
Hi Roberto,
For the most part, if you are writing ES6, you are going to need some sort of transpilation to make it run with Node. The latest Node versions are mostly ES6 compliant but not quite (I think the latest Node version still does not have ES6 Module support). WebStorm and VSCode both have great support for source maps, so you really don’t need to care how the code is being transpiled under the hood. However, if you happen to be writing “node-compliant” ES6, then you could just run the node process directly in the debug session.