Being the IT Operations Engineer at Atomic Object means that I’m responsible for all of the internal infrastructure. That involves making sure everything is properly running, as well as forecasting when we might need more resources for our makers or leadership to complete daily tasks.
One of the tasks our leadership handles daily is running queries against our databases hosted in AWS. Visualization of data is a great way to see the data more clearly, and it makes analyzing that data much easier.
I was tasked with finding a visualization tool that could connect to our databases. First, I tried Apache SuperSet, AWS QuickSight, and Redash. After a few months of trial and error, I settled on Redash, an open-source tool that came with many great reviews and an extensive knowledge base.
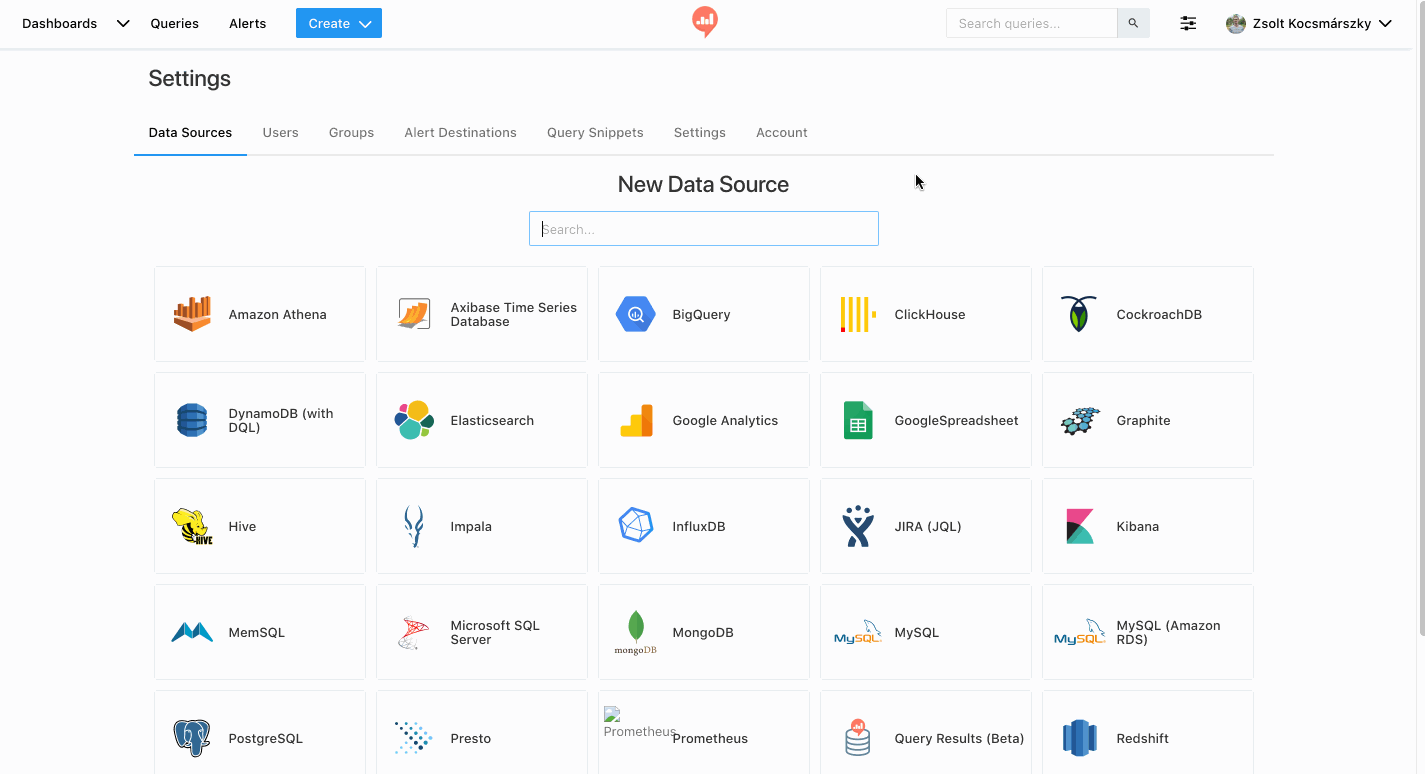
Redash was able to give us a better sense of our data because of its visualization capabilities, ability to create and share dashboards, and powerful query editor. With that query editor, Redash supports SQL, NoSQL, BigData, and API data sources.
The great thing about setting up this AWS EC2 instance is that Redash comes with pre-cooked AWS AMIs (Amazon Machine Images) for each region. Each of those pre-made instances hosts multiple Docker containers with all of the processes for running data visualization.
I found the process straightforward. You install the Redash instance, and then comes the fun. After configuring the AMI for your region, you have to set up environment variables for Redash. These include:
- Your mail server, which would be in this format for AWS: email-smtp.us-west-X.amazonaws.com
- Configuring SSL and TLS
- Your default mail sender (in this case, [email protected])
- Other variables, such as the hostname where you will find your Redash instance online
Another great feature of Redash is the ability to set up an SSH Tunnel. This is extremely helpful when you want to connect to your data source in Redash, but don’t want to SSH each and every time.
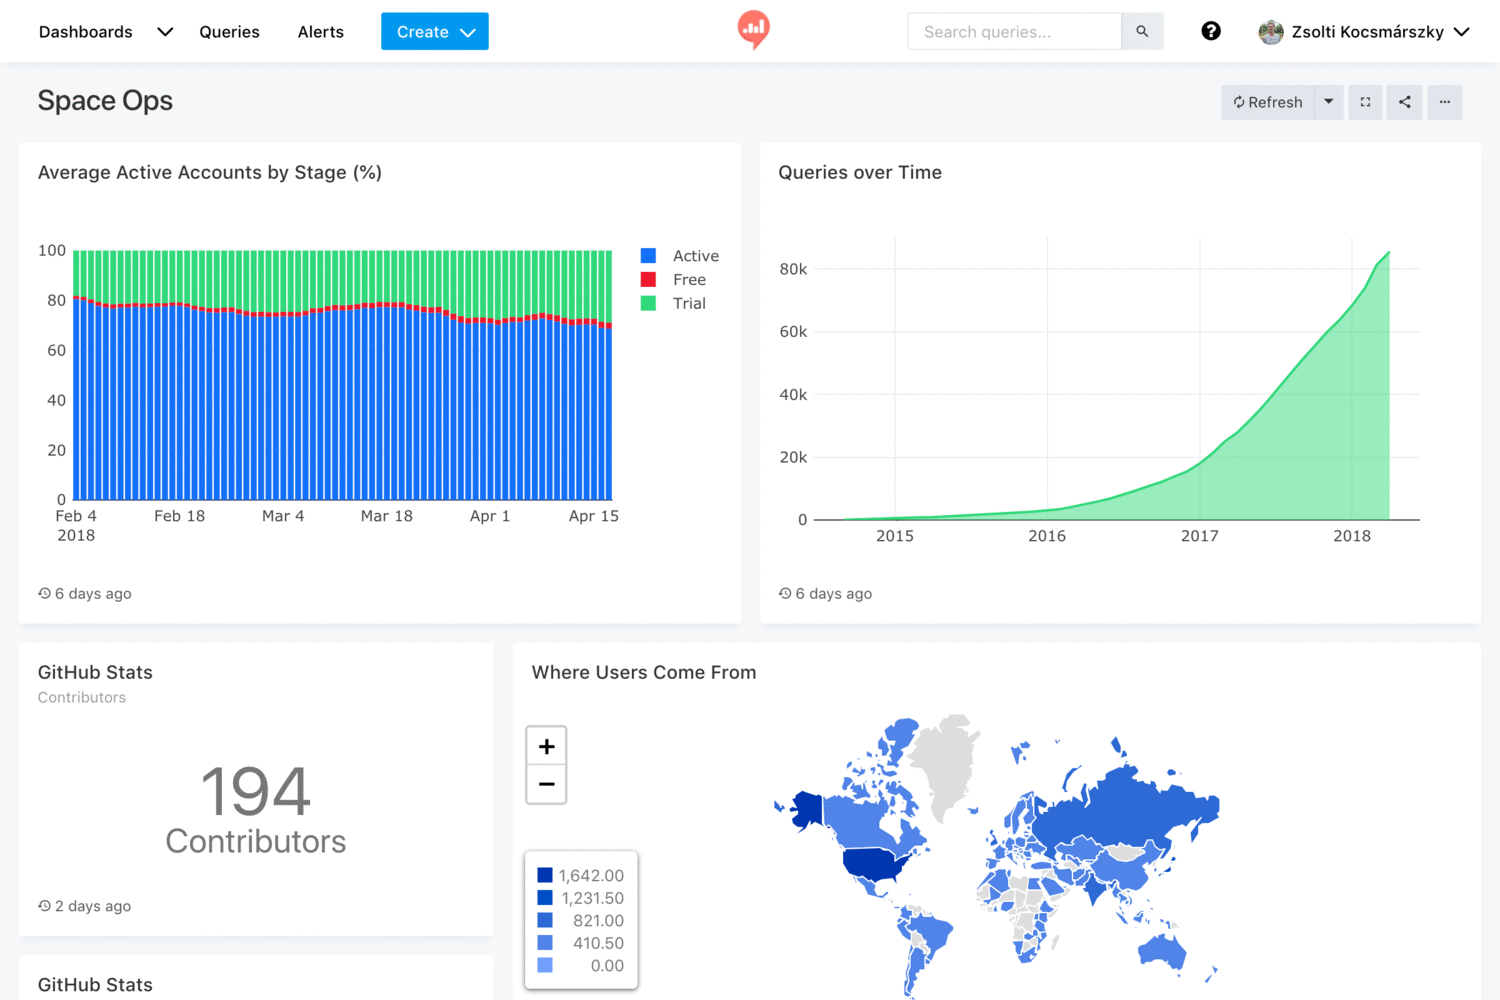
Once your instance is online, you can set up your dashboards and connect Redash to the databases where you want to see your information. This has been a great help to the leadership here at Atomic Object, as it lets them see everyone’s hours billed to a client, or how much money a project is costing, or even the stats for this blog.
Redash is an all-encompassing tool when it comes to data visualization, and it gives new life to understanding your data. We expect to make great use of it at Atomic Object.