At the beginning of a project, there can be a lot of uncertainty about upcoming work. We recently had success doing an exercise called relative sizing and modeling our results with a burn-up chart. It helped the team understand the scope of work and uncover questions and risks earlier. It also gave the stakeholders a nice visual showing a rough estimate of when work may be completed.
Relative sizing is a method of scoping that evaluates how complex the features are relative to one another. Here’s how we approached it.
1. Break the work into features.
Features are typically too large to estimate with any precision, but they help to define the work into more tangible ideas. Each one should have a business hypothesis tied to it so that results can be measured after release.
Your features might be something like this:
- User can reserve a room
- User receives reservation reminders
- User can pay by credit card
- Admin can manage user roles
2. Break the first feature into stories; estimate those stories.
For the first feature, “User can reserve a room,” the team should conduct a regular planning session to define chunks of work (i.e., stories) small enough to estimate.
From there, the team can estimate each story using their normal estimation practices. It can then be said that the feature is “X points” total. In this example, we’ll say it’s 50 points.
3. Evaluate each other feature as it relates to the complexity of the first.
Instead of going to the story level for each of the other features, the team should ask: “Based on the requirements we know now, do we think ‘User receives reservation reminders’ is more complex or less complex than ‘User can reserve a room’?” If it’s more complex, then ask, “How much more complex?”
Let’s say it’s twice as complex; the team will then assign 100 points to feature #2. They will continue this exercise to create relative estimates for the remaining features.
Here is what it might look like at the end:
| Features | Estimates |
| User can reserve a room | 50 |
| User receives reservation reminders | 100 |
| User can pay by credit card | 50 |
| Admin can manage user roles | 30 |
Teams will have typically also have a list of open questions they want to ask the product team related to each feature.
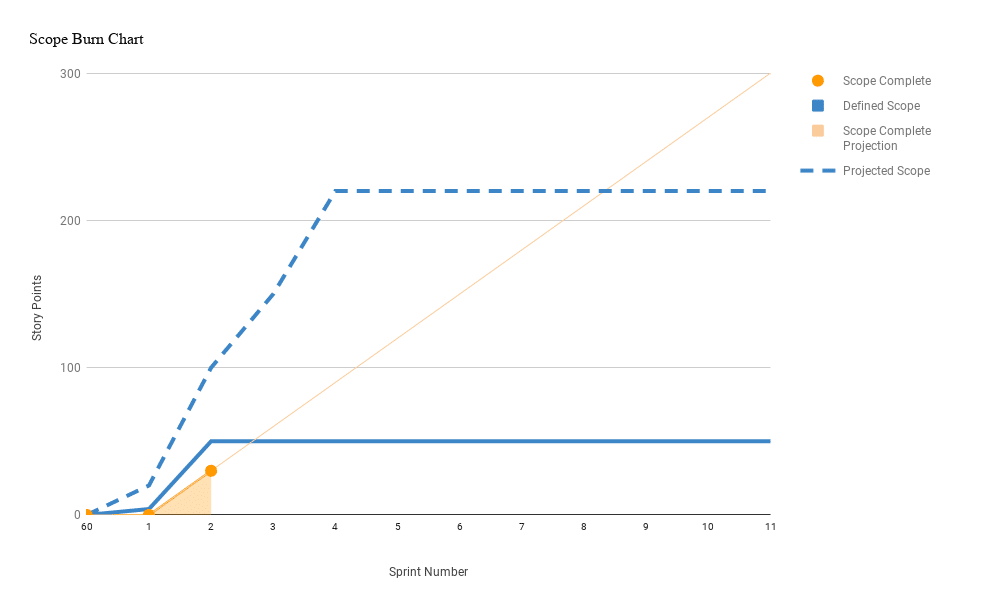
4. Visualize your relative estimates with a burn-up chart.
Now you can use a burn-up chart to display the scope of the project and your team’s work progress. Burn-up charts are superior to burn-down charts because you can more easily see scope increases and better manage them.
In this example, you can see the team has only estimated work for the defined scope of the first feature (solid blue line). But they’ve scoped work for all four features (dotted blue line). With an average team velocity of thirty, the team will complete work near sprint eight (where the salmon and dotted blue line cross).
Is this method a guarantee? No, of course not. As you get into the work, you will find some features are more complex, while others are less. Nevertheless, we’ve found this method very helpful for both the team and the stakeholders.
What scoping exercises have you used at the beginning of the project?