Article summary
Recently, I worked on a Maven project that relied on a proprietary pipeline framework to execute the code we were writing. Because of the obfuscation of this proprietary code, my teammates and I wanted to be able to debug our own code from our IntelliJ IDE. However, we were not using the build functionality offered by IntelliJ IDEA. Instead, we used a Maven exec command with several specific configurations to run the pipeline locally.
Fortunately, the Maven CLI comes pre-packaged with a debug tool that makes it easy to connect our executing code back into IntelliJ. Here are the steps we followed.
Background
Before we dive into setting up our debugger, I need to explain two concepts.
MvnDebug
The Maven CLI comes prepackaged with an additional command that allows you to hook into executions with a debugger: mvnDebug. You can replace any mvn command with mvnDebug, and the command will immediately be queued up to execute once a debug listener hooks into it at the correct port. This command always listens on port 8000.
IntelliJ IDEA
IntelliJ IDEA is a powerful development tool made by JetBrains specifically to work with the JVM. Like all JetBrains IDEs, it offers many shortcuts and tricks to improve your development experience, and the debugging tool suite is immensely valuable for tracking down tricky bugs.
Setup
Alright, how do we wire everything up? We first need to set up a build configuration in IntelliJ that will connect a debug listener to the waiting Maven execution.
- Open your Maven project in IntelliJ.
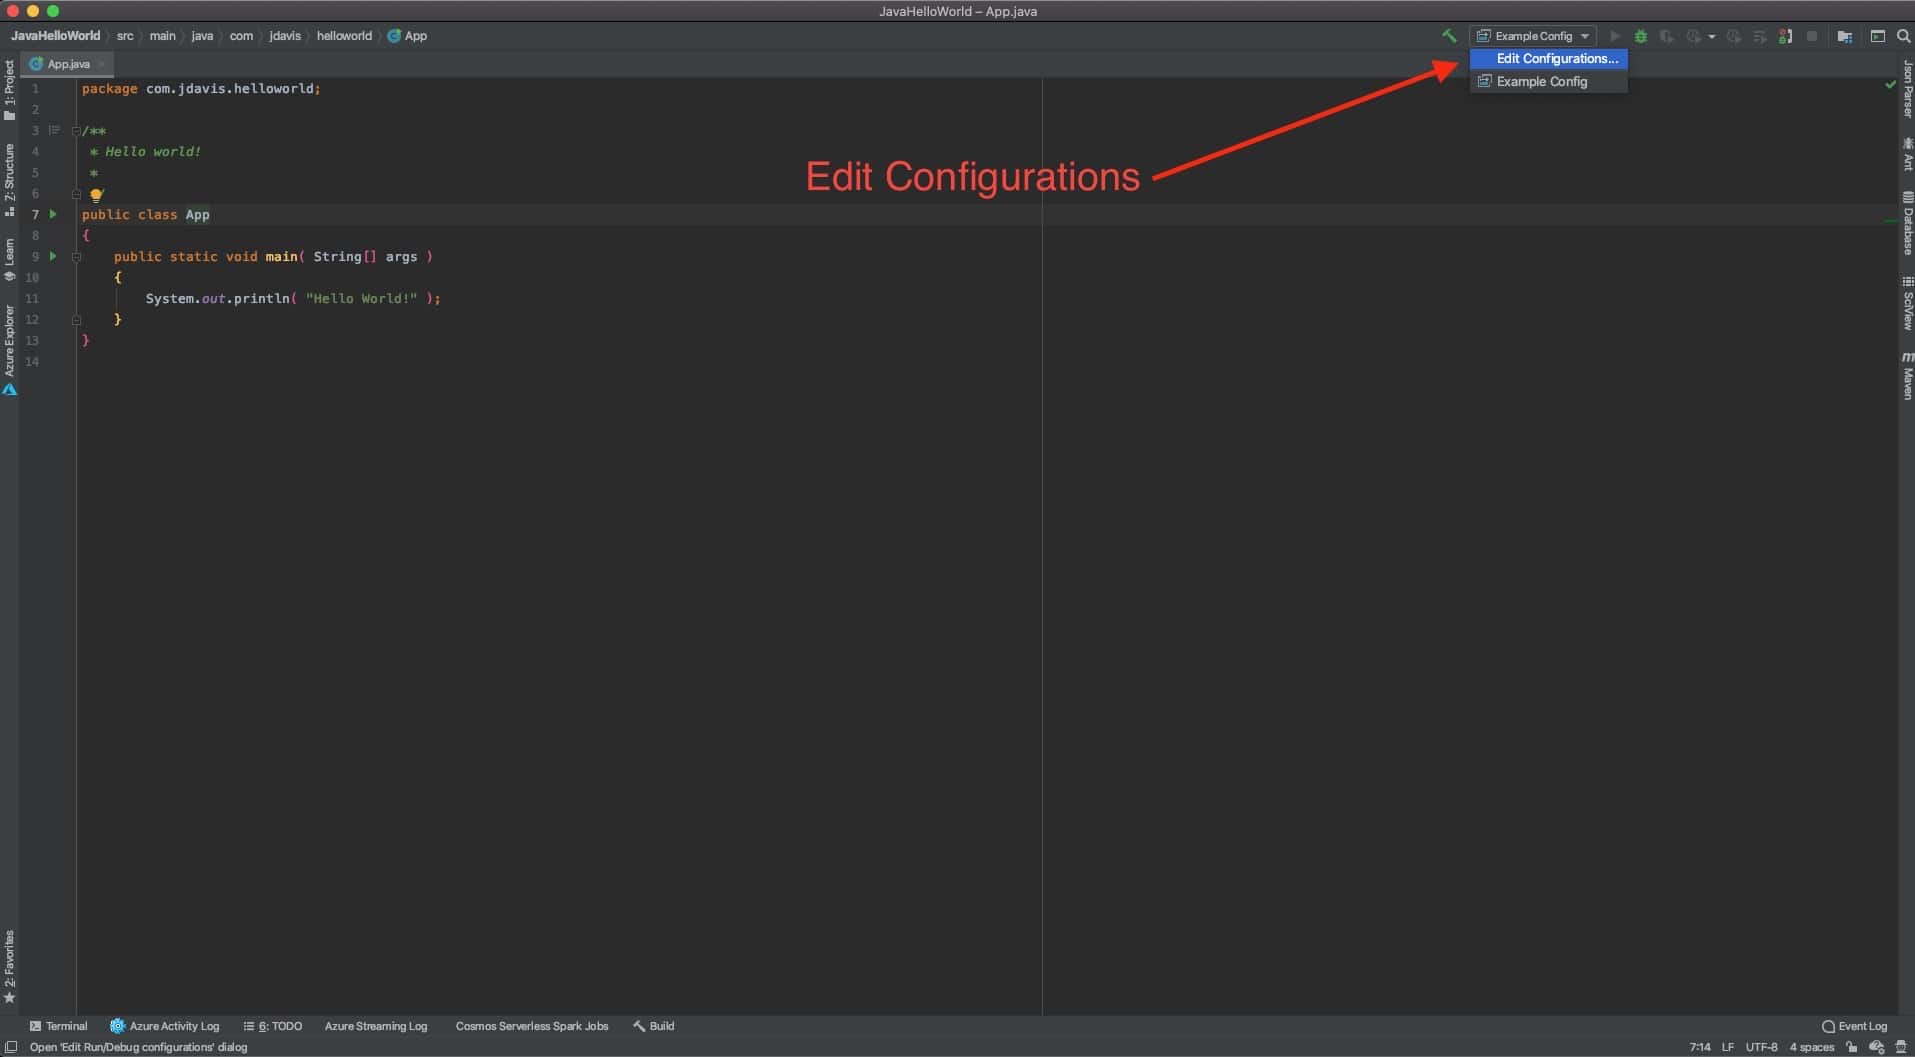
- In the top right corner of the IDE, there’s a dropdown for configurations. If you have existing configurations, select “Edit Configurations.” Otherwise, select “Add Configuration.”
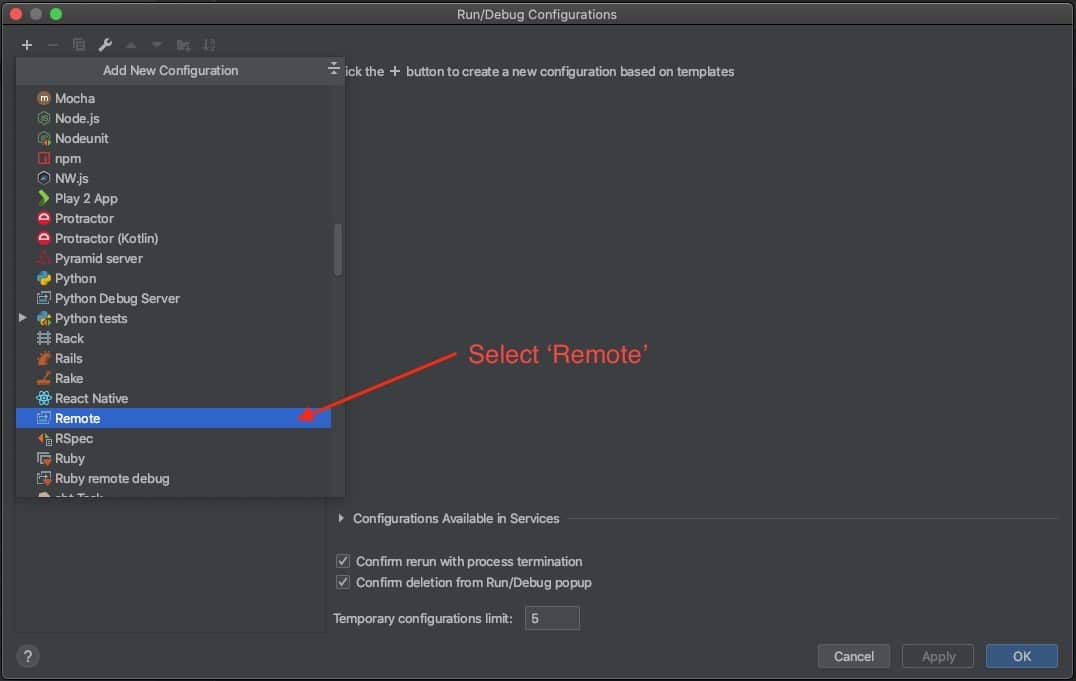
- Click the plus sign in the upper-lefthand corner to open the menu; select “Remote.”
- Name this new configuration something meaningful (I named mine “Mvn Debugger.”), make the host “localhost,” and change the port to 8000.
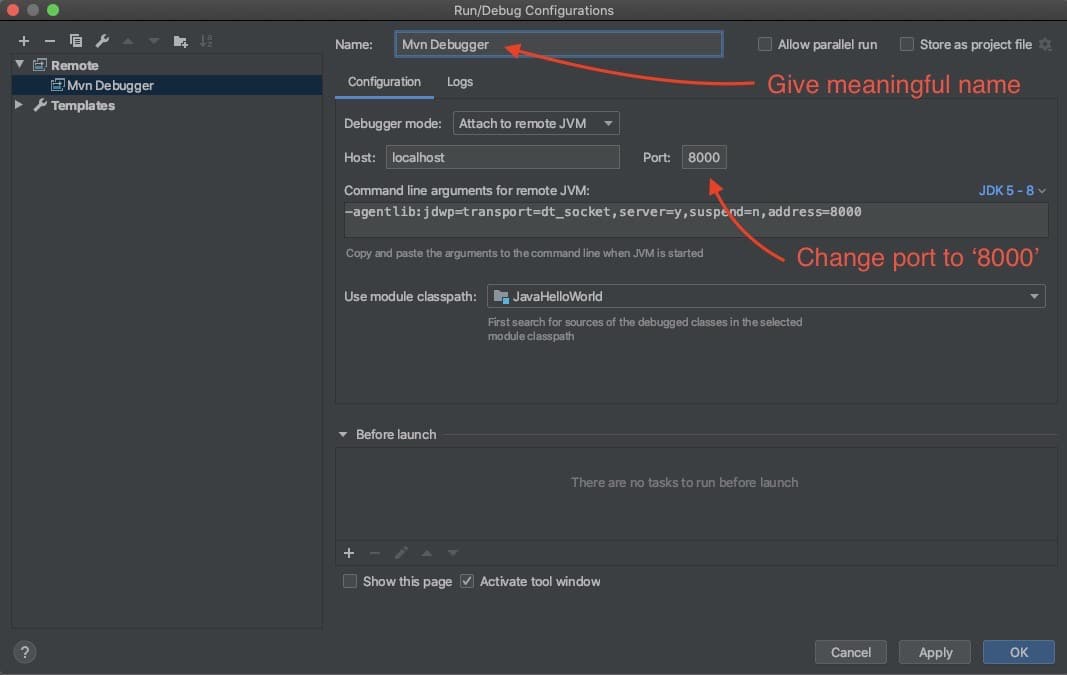
- Click “Apply” then “OK” to close the dialog.
You now have all the pieces needed to debug your Maven build in IntelliJ!
Let’s Debug
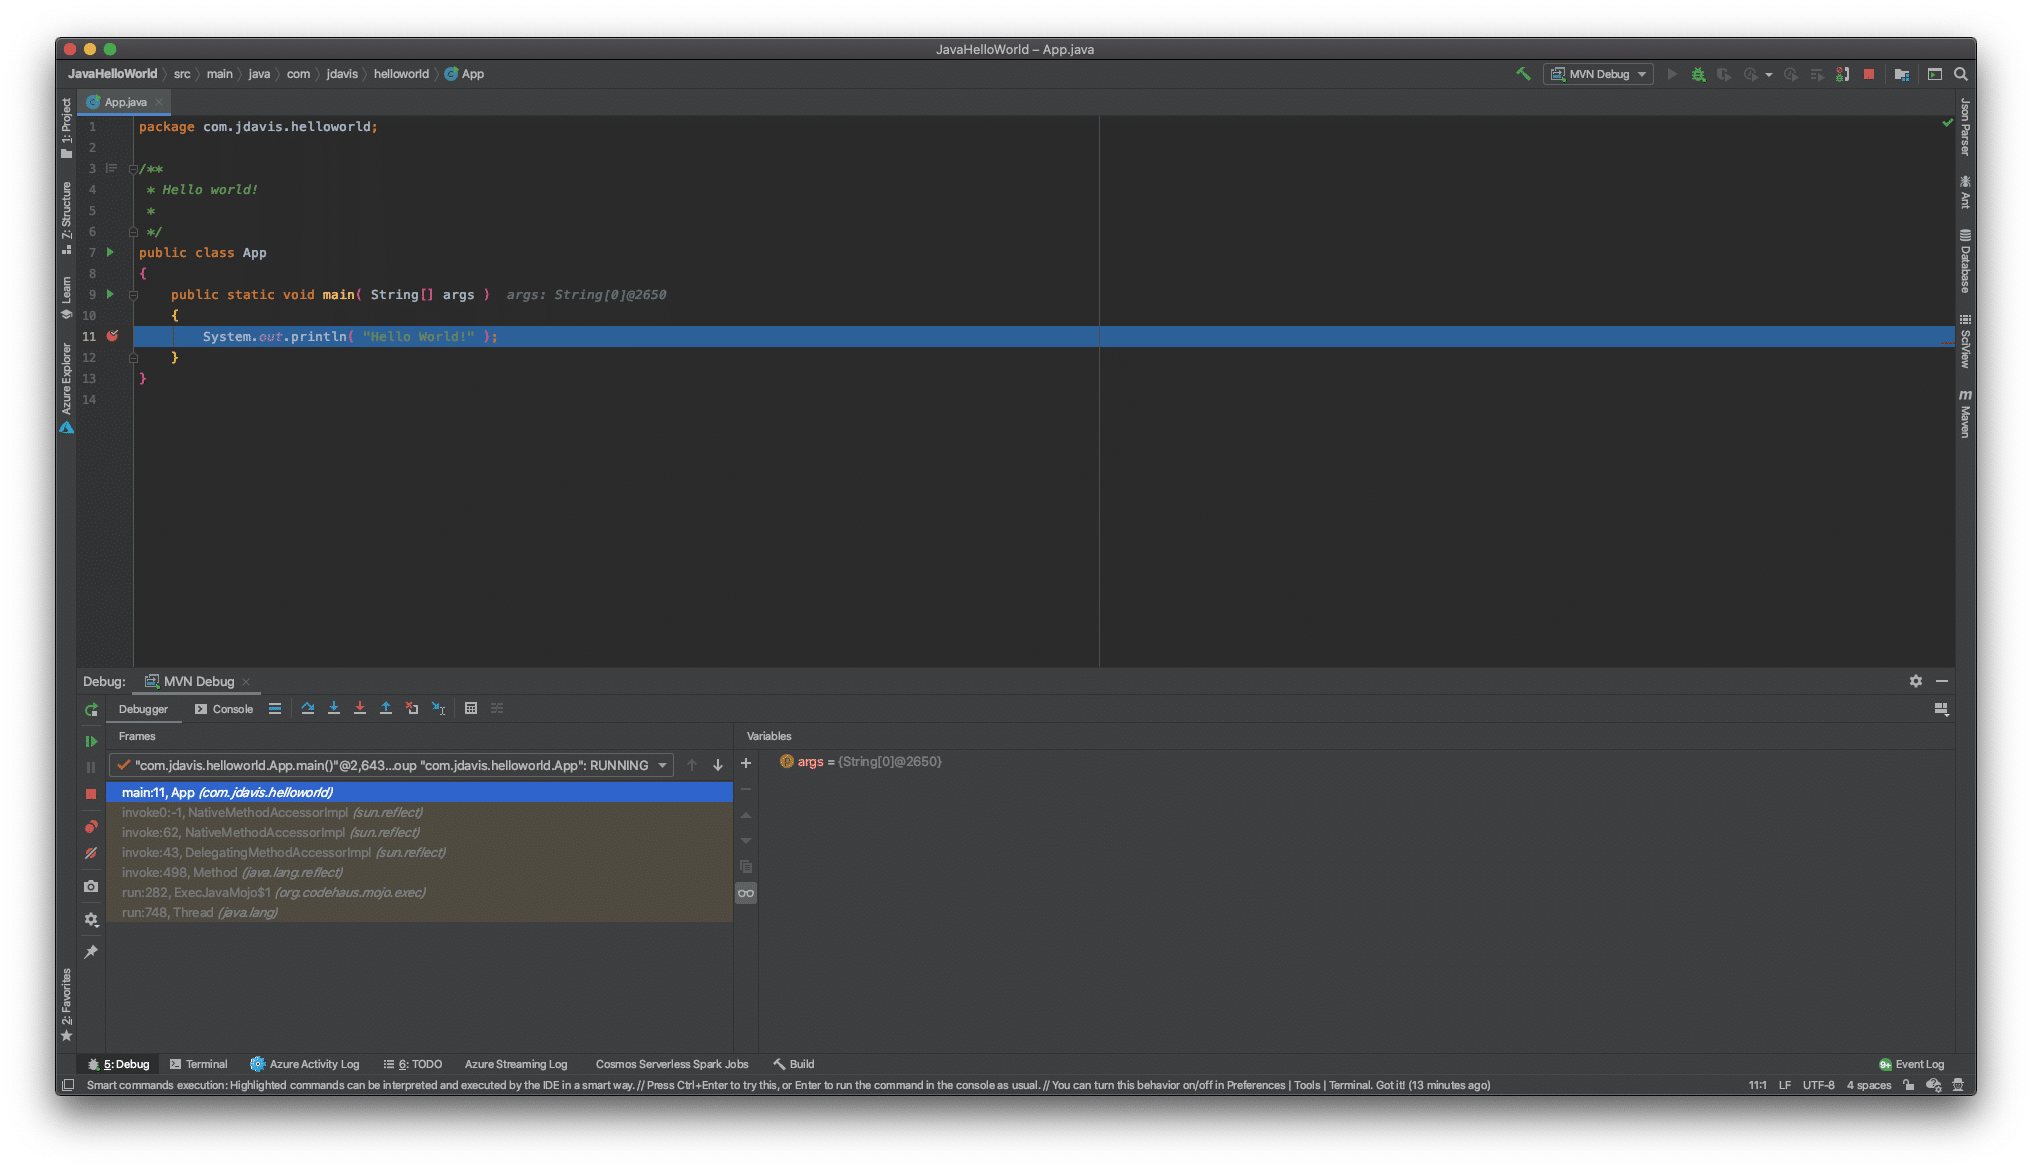
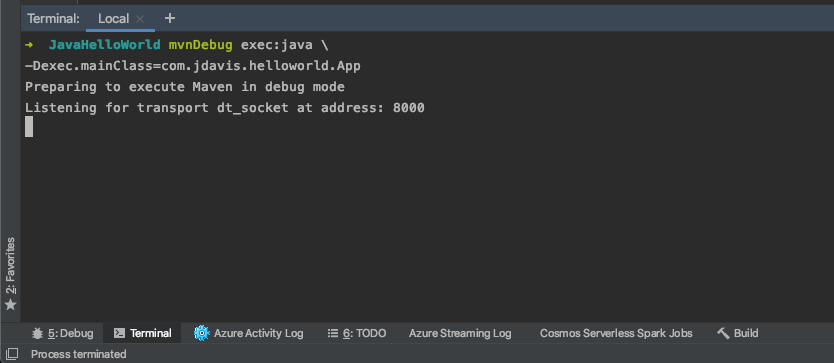
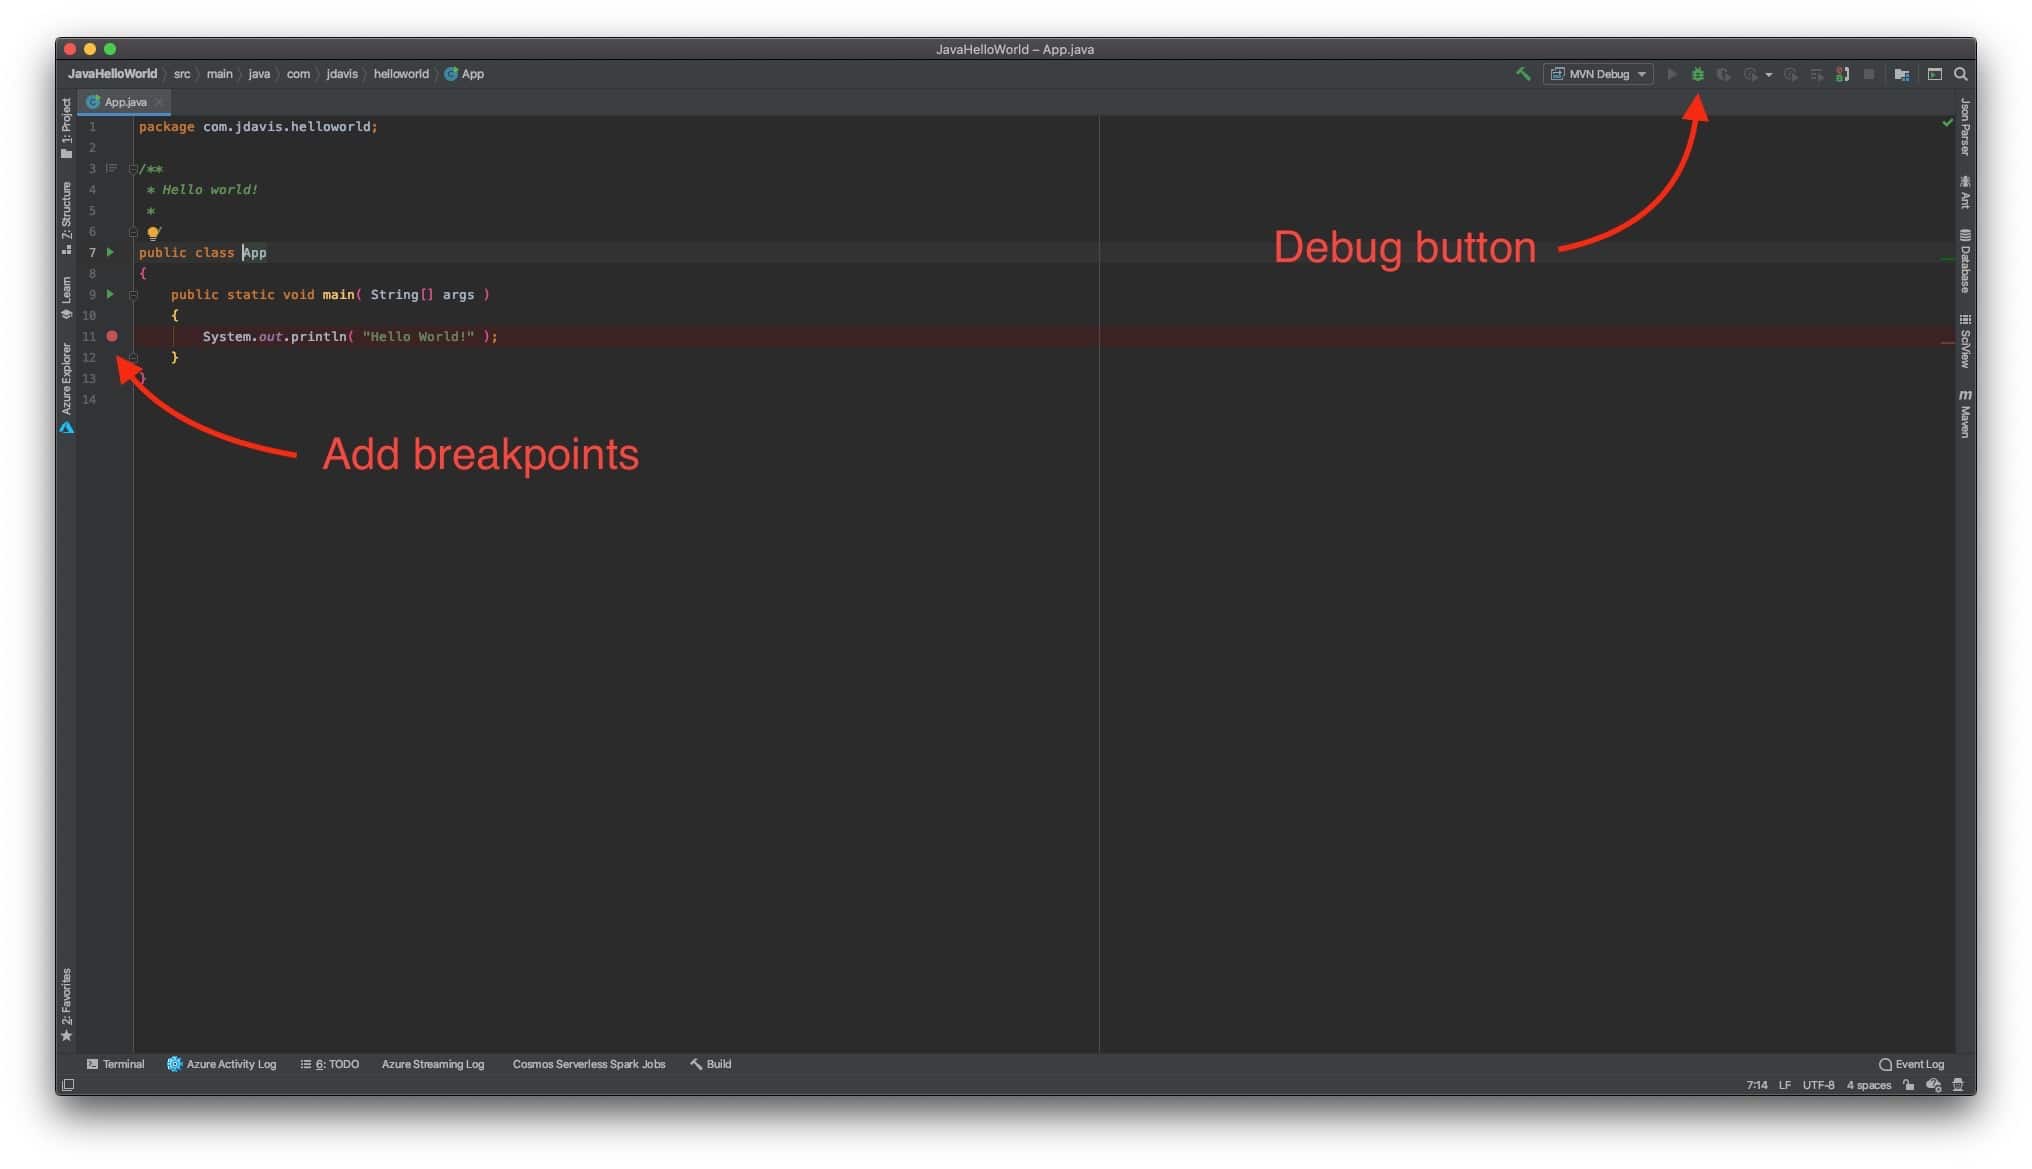
In the IDE, add debug points where you want the debugger to pause during execution. Then in the terminal, enter your Maven execution command, replacing mvn with mvnDebug.
Execute the command, and you should see the following output:
In IntelliJ, make sure your debugging configuration is selected, then press the “Debug” button.
Back in your terminal, you should see whatever output your code would report during normal execution. As the code executes, it will pause at the breakpoints you have set, giving you access to IntelliJ’s powerful debugging set of tools.