
At Atomic, we’ve always pushed ourselves to measure things that matter to our business. For us, that includes data like billable hours, project rate, incoming sales opportunities, and the amount of market demand we see for our services.
Using a visual medium to communicate the data is very helpful, so we use dashboards to quickly get a broad view of how our business is running. In this blog post, I’ll summarize how we’ve used a few technologies — Redash, SQL, Google Sheets, and Google Apps Script — to create dashboards with rich data visualizations.
Why Redash?
We’ve been using Redash for over a year now. Its best feature is the ease with which it integrates with external data sources. We connect it directly to SQL databases that contain information about our business operations, specifically capacity/project planning and timesheet data.
We chose Redash for three reasons:
- Support for Self Hosting – Generally, we’re loathe to add another self-hosted system to our toolbelt. But by self hosting, we were able to easily secure the system and pay no monthly licensing fee.
- Flexibility – We write custom SQL queries against our data sources.
- Number of Supported Data Sources – Redash supports many data sources; we’re particularly interested in PostgreSQL, Google Sheets, and other Redash queries.
Adding Data Sources & Queries
Redash Queries “use the query language native to the data source.” So if you connect to a PostgreSQL database, for example, you will write a data query against that data source using PostgreSQL syntax and API.
Relational Databases
The first thing we were interested in integrating with were our PostgreSQL databases. Redash provides a nice starter guide, but it’s pretty straightforward. You just choose PostgreSQL from a list, then enter the database URL and your Postgres password.
Once a database is connected, you must create a new query:

Select the data source from the left side of the Redash web application. Here, I’ve connected our time-tracking database, named “Punchit_Production.”
Google Sheets
To give Redash access to a Google Sheets document, you must create a Google Service Account. Once the data source is set up, connecting to the sheet is easy. Instead of selecting the sheet on the left side of the Redash app UI, you must fill in the sheet ID in the query edit box:
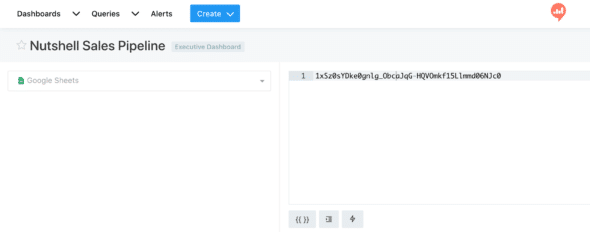
When using Google Sheets, the result of the query is simply a table with the sheet contents.
Other Redash Queries
One useful trick I’ve found is to write queries against the result of other Redash reports. This approach lets you chain multiple queries together.
First, find the ID of the query you want to reference; when editing the query, it’s the number at the end of the URL (e.g., https://redash.yourcompany.com/queries/103). Then, reference that ID in another query’s code as query_ID, for example:
SELECT * FROM query_103
This approach is especially helpful with Google Sheets integration. You’ll need one query that is connected to the sheet; the result of that query is simply the data in the sheet. Then, create a second query that references the first, using the above ID technique, and manipulate the data using query syntax (SQL).
Leveraging Google Apps Script
Google Apps Script is a powerful tool for writing custom software that interacts with G Suite productivity apps. To create a new Apps Script function from Google Sheets, select Tools then Script Editor.
In our case, I used Apps Script to make API requests to our CRM software, Nutshell. Nutshell provides an API that I used to request all of our open sales opportunities and their dollar amounts.
function getPipelineData() {
  let headers = {
    "Authorization" : "Basic " + Utilities.base64Encode('[email protected]' + ':' + 'appkey')
  };

  let params = {
    "method":"GET",
    "headers":headers
  };

  Logger.log("Fetching!");

  let url = 'https://app.nutshell.com/rest/leads/list?q=&filter%5Bstageset%5D%5BanyAll...'
  let response = UrlFetchApp.fetch(url, params);

  let data = JSON.parse(response.getContentText());

  // ... Push data to the Google Sheet
}
This code runs nightly and fetches all of open sales opportunities, sums their values, and adds them to a new row in the Google Sheet. The Redash queries that integrate with Google Sheets also update daily. This creates an automated workflow and generates a visualization of our sales pipeline value over time.
Visualizations & Refreshes
The final step in the process is to create a custom visualization from your Redash query output. To do so, select + New Visualization within the query editor UI. This brings up the visualization editor, which is a fairly standard chart editor that should be familiar to anyone who has used productivity software before.
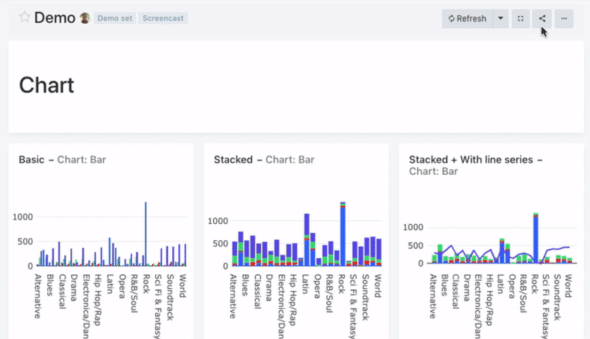
Once a chart visualization is set up, you can create a Redash dashboard — a grid of visualizations that update based on their corresponding query’s refresh schedule. Here’s a basic example from Redash’s website:
I’ve found Redash to be a powerful, flexible, and — best of all — easy-to-use business intelligence tool. It integrates well with many data sources we’re already using and has automated a lot of manual reporting processes we used to use.
After I initially left a comment I seem to have clicked on the -Notify me when new comments are added- checkbox and now every time a comment is added I recieve four emails with the same comment. Perhaps there is a way you can remove me from that service? Kudos!
Hi Zackary. Sorry you’re getting too many emails. I did some Googling and am wondering if this link will help you get your preferences better suited to your needs: http://dashboard.wordpress.com/wp-admin/index.php?page=subscriptions&option=comments
Sincerely,
Elaine