When working with Redis, having a good visualization tool means having clear insights into your application state. Whether you’re debugging stream processing or inspecting JSON field-value pairs, choosing the right visualization tool is a must for developer productivity.
TablePlus: the Minimalist Approach
For those unfamiliar with TablePlus, it’s a database management tool that supports a variety of databases, including Redis. I love the amber elephant for showing me Postgres data — I don’t find it wanting in that regard. For Redis, however, TablePlus takes a minimalist approach to visualization.
Take for example the interface for viewing a Redis stream. For context, each stream is called a thread here to represent different conversation threads (e.g., thread:1).
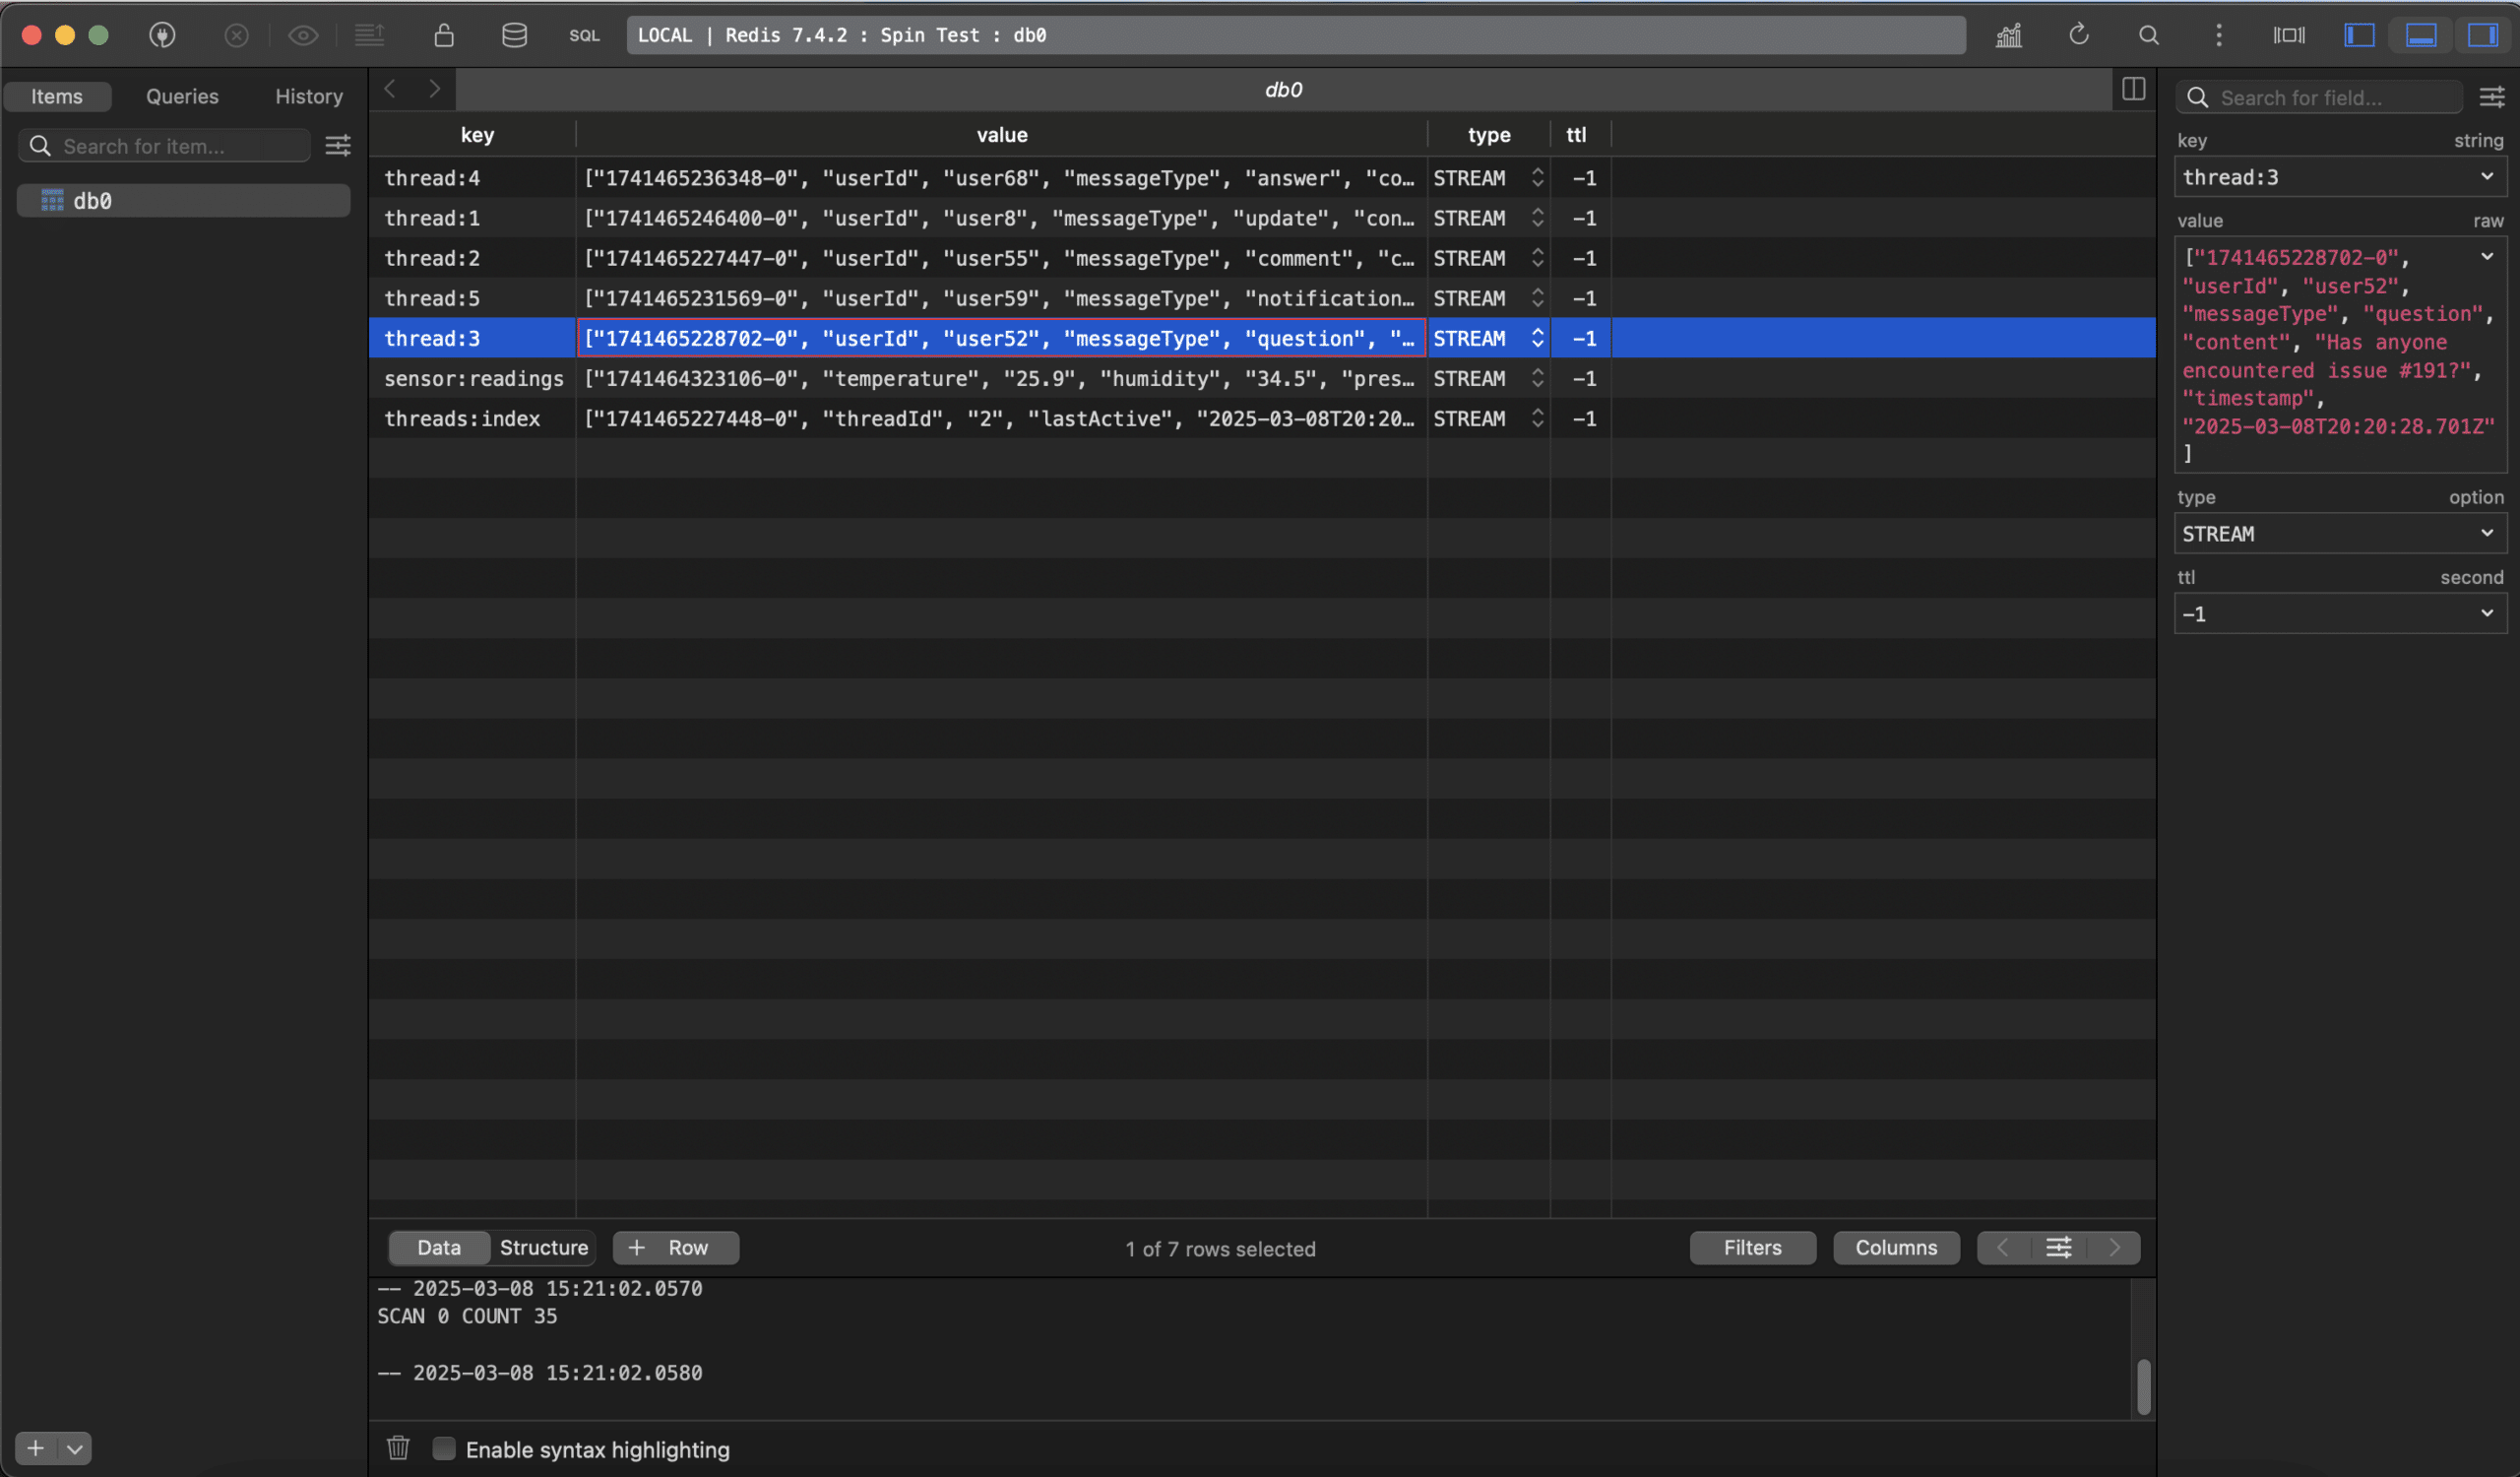
Here I can search by key to find the desired stream, but TablePlus flattens the hierarchical nature of Redis streams into a single table view. TablePlus’s tabular approach loses the natural hierarchy, making it harder to visualize the stream’s structure and content, and generally unhelpful for debugging.
TablePlus still provides the ability to compose Redis commands. Take a look:
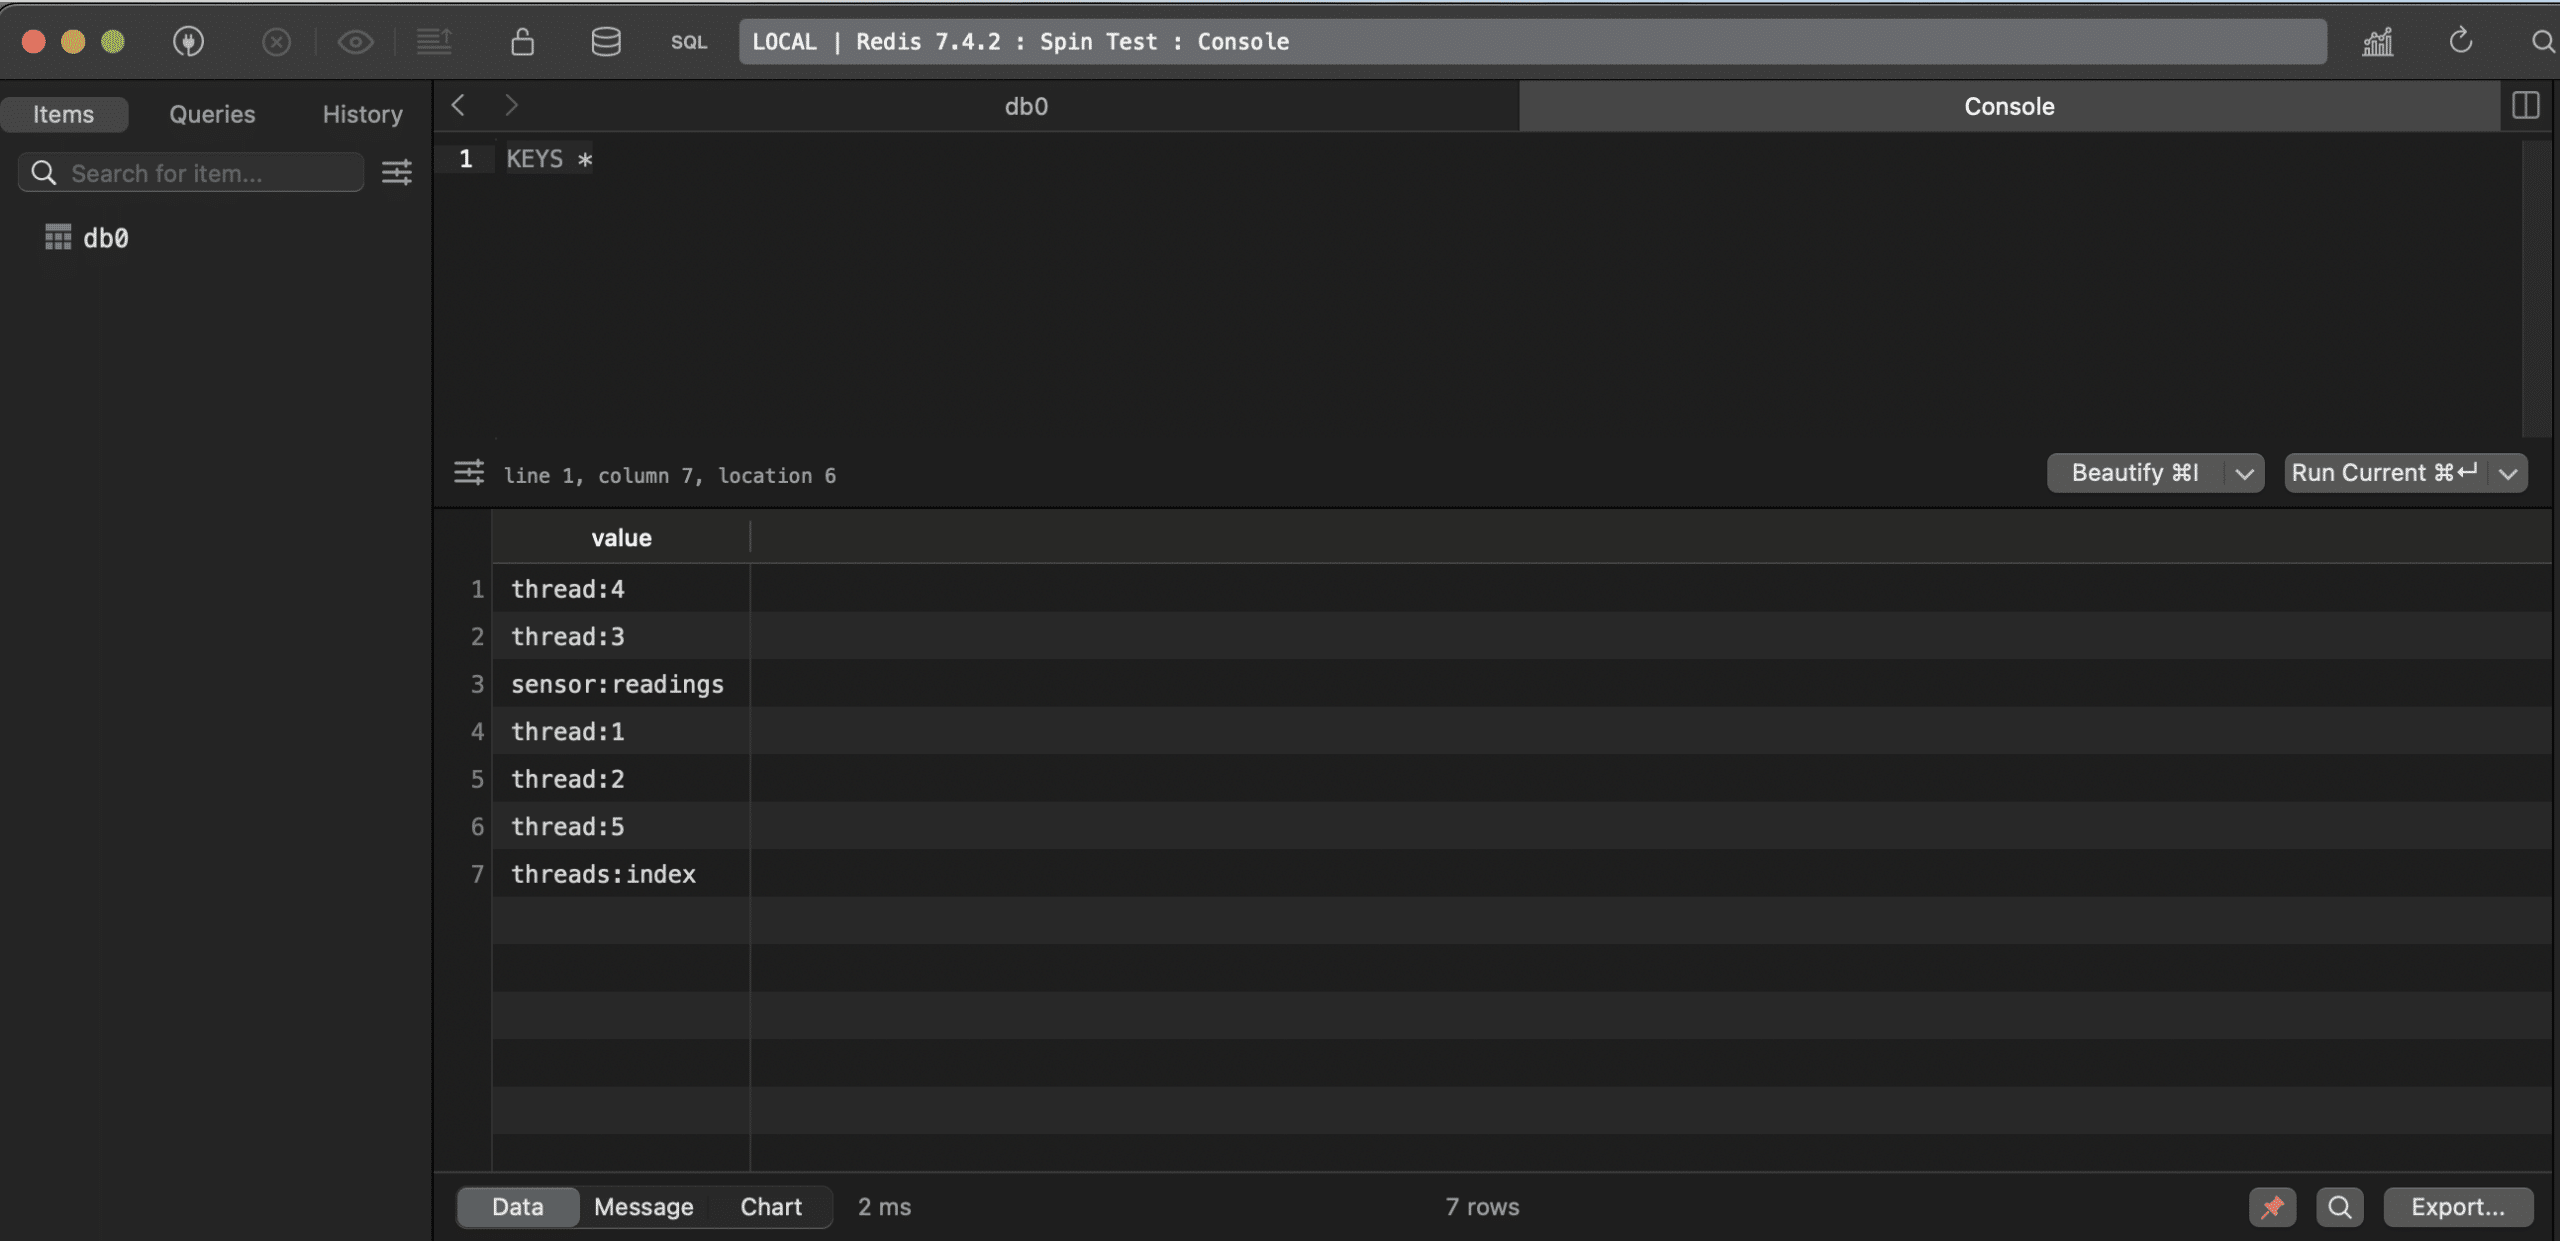
Similar to the way you can with a Postgres database, TablePlus provides a console interface where users can write and execute native Redis commands to query and manipulate stream data more precisely.
Another huge miss in this UI is the lack of entries. A Redis stream is a single append-only data structure containing multiple entries, each with a unique timestamp-based ID and a collection of field-value pairs (not JSON payload). TablePlus only renders a subset of these entries per stream. This partial representation inhibits a user’s ability to form an accurate mental model of their stream’s content and structure.
Takeaways:
- Desktop application with free tier. ✅
- Basic visualization with limitations. 👎
- Redis commands in the console. ✅
Redis Commander: the Web-based Alternative
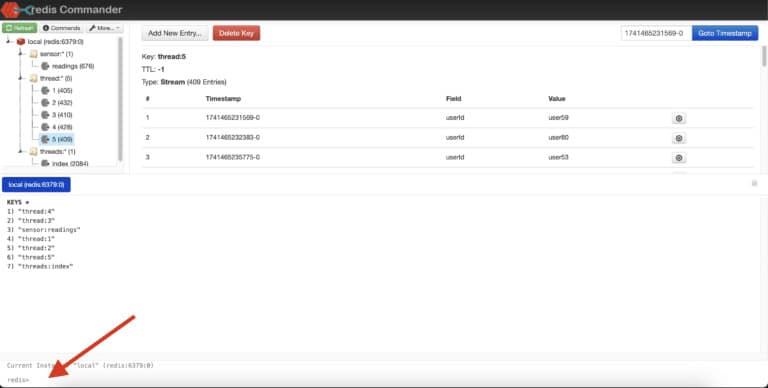
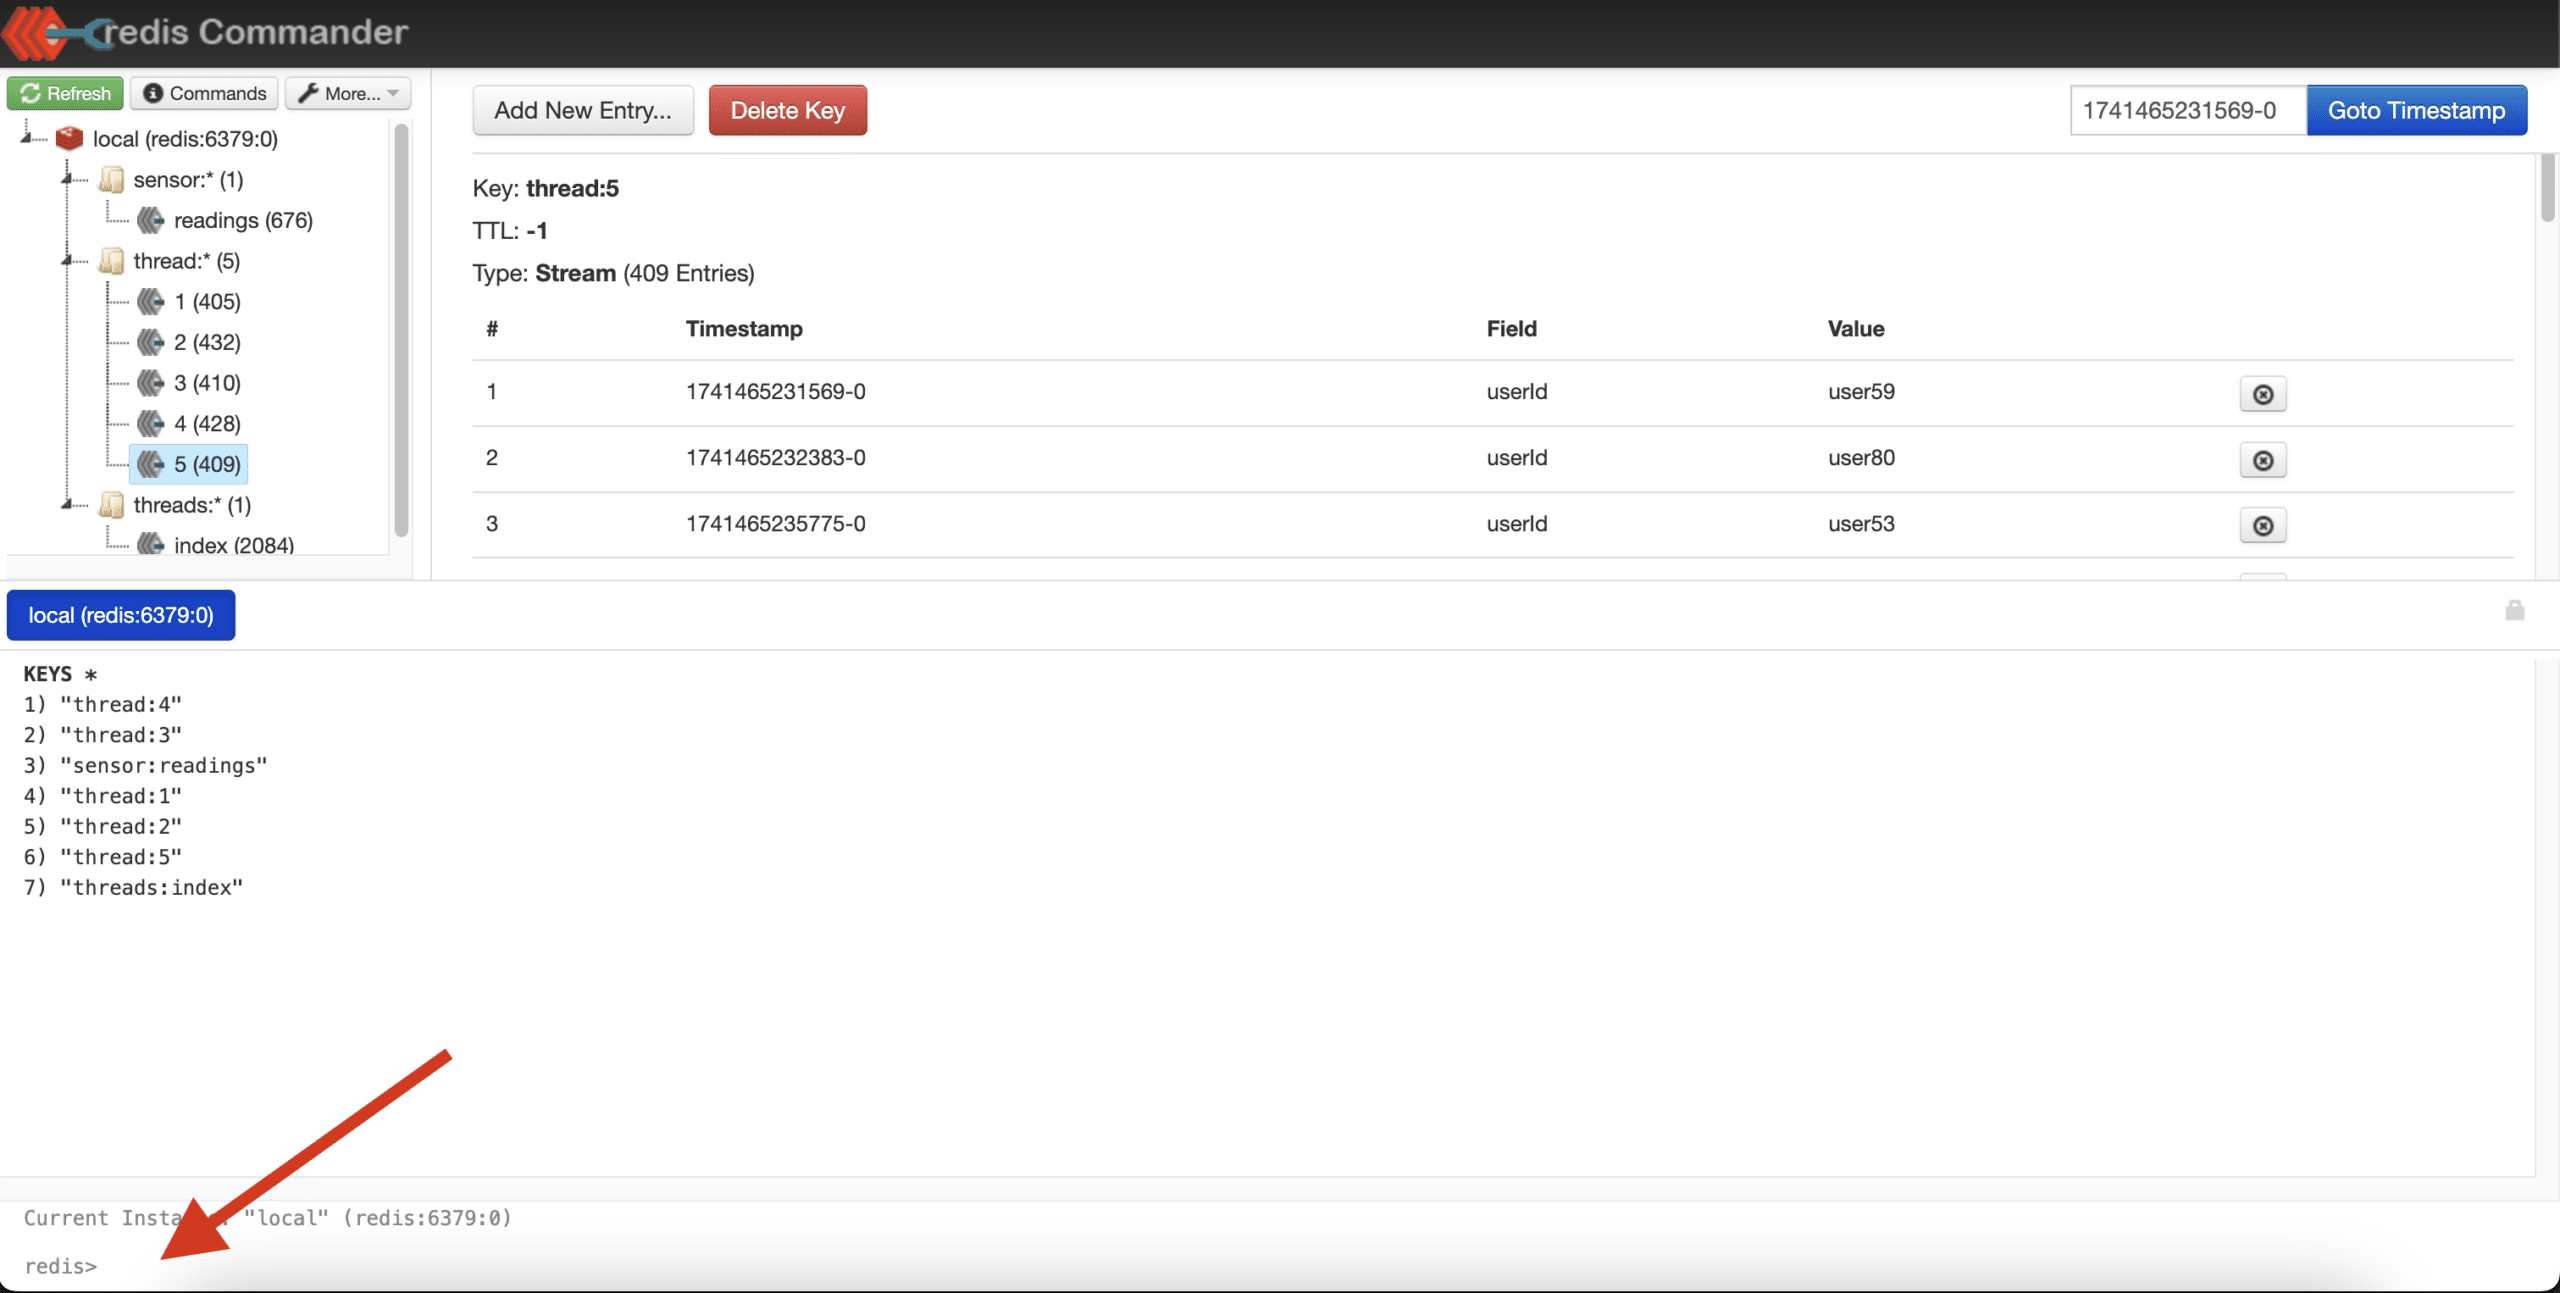
Redis Commander, a free, web-based interface, offers more Redis-specific features with its web-based interface. Let’s take a look at the interface for viewing a Redis stream:
Note how the stream structure is preserved, making it easier to understand the relationships between each stream and its entries. I can also immediately see the ID of each entry, which is useful for filtering and sorting, I don’t need any scrolling to see the TTL, and the JSON key-value pair is much easier to read.
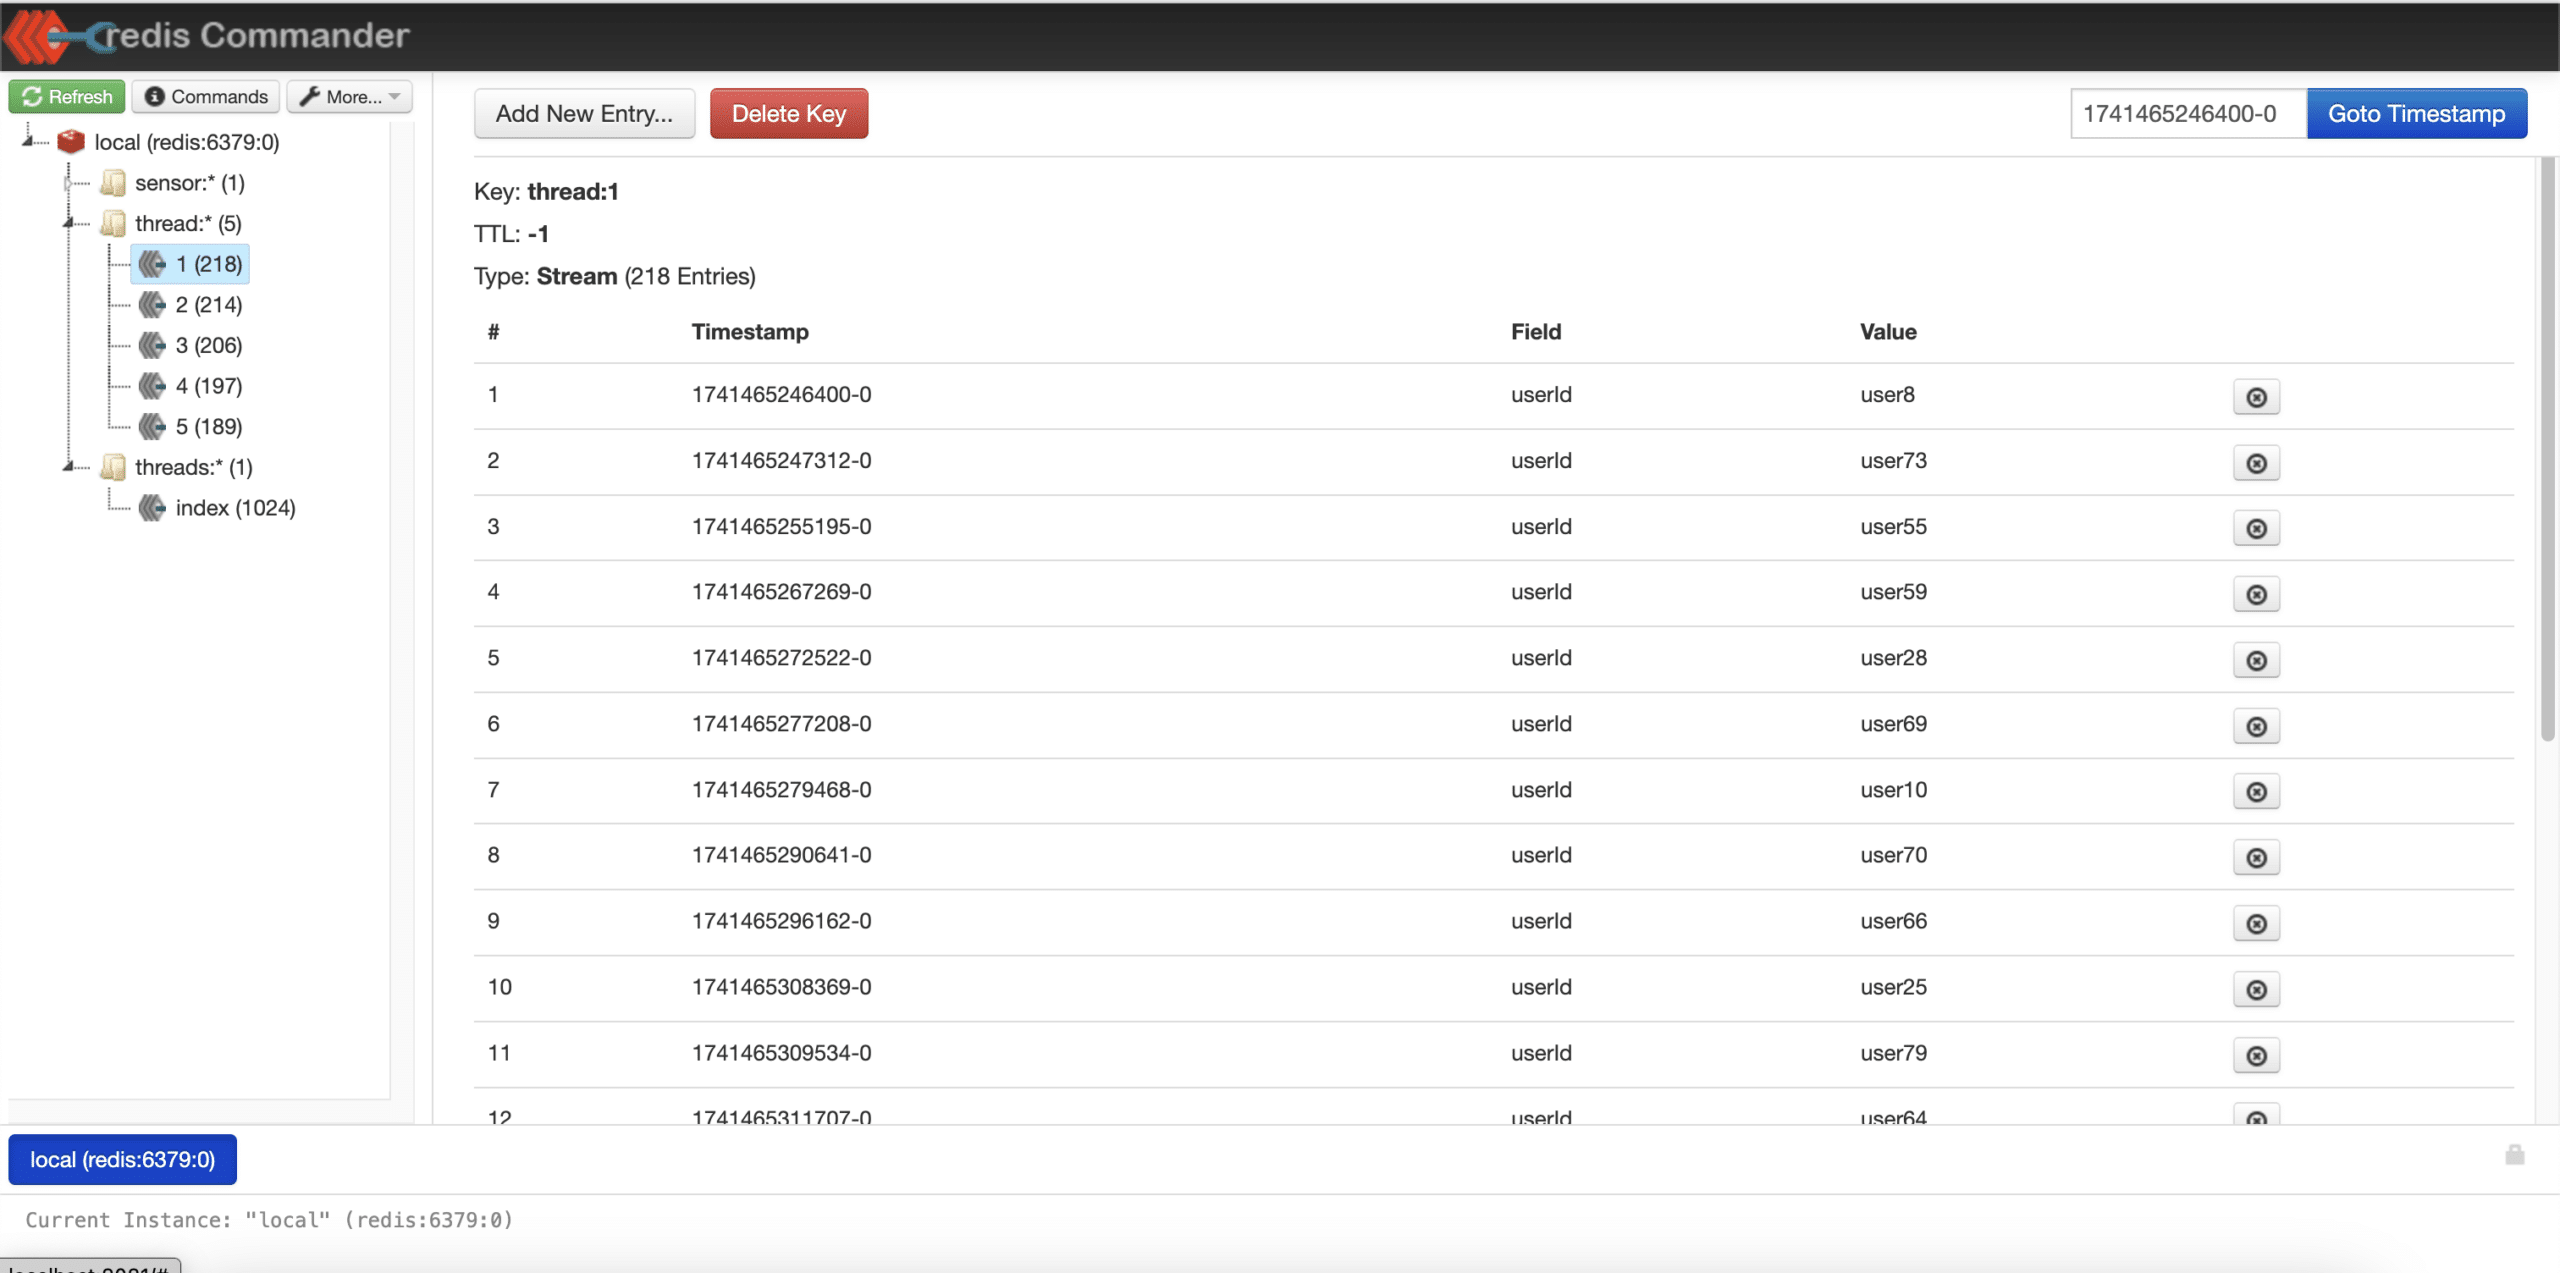
Like TablePlus, Redis Commander also allows a user to compose Redis commands. Note the red arrow below:
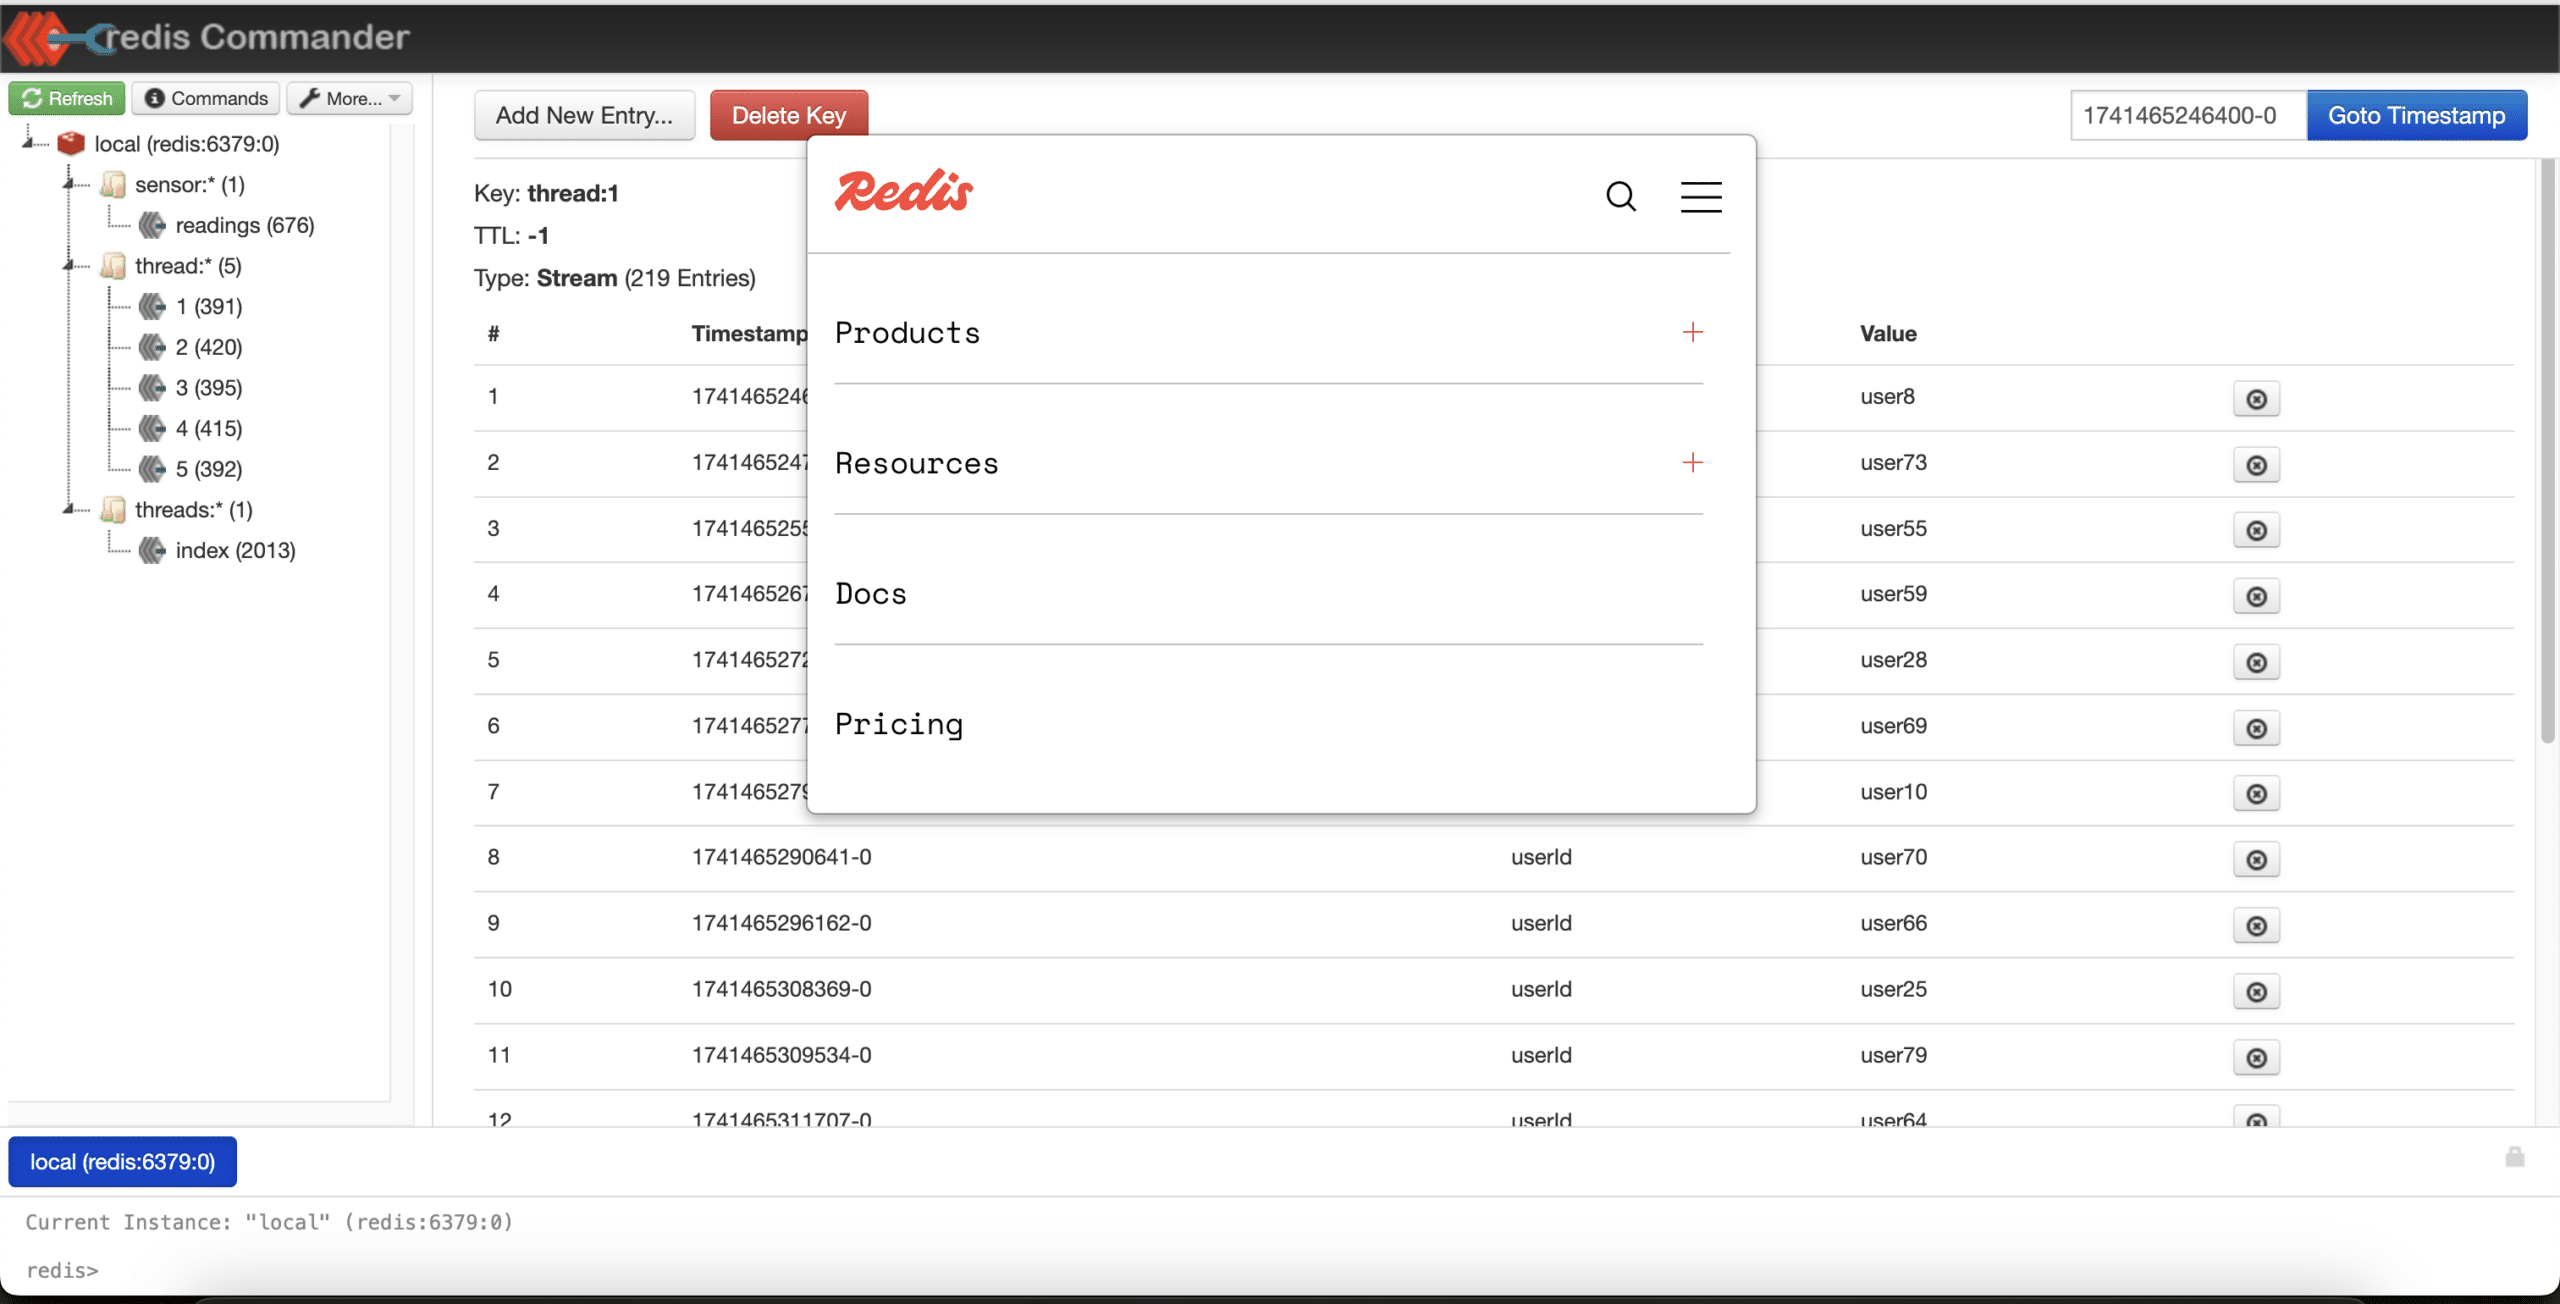
While it provides functionality for Redis development, Redis Commander has some limitations. For example, a stream with multiple entries will be truncated at 20 entries unless you search by a specific timestamp.
Furthermore, its UI isn’t always intuitive. While helpful, the command link in the “More” toolbar launches this modal with no visible cancel button. And, clicking outside the modal fails to close it. 🫤
Takeaways:
- Free. ✅
- Web-interface. 😐 Kind of prefer a desktop app—I have enough tabs open already.
- Some features are not intuitive. 👎
- Good visualization with some limitations. ✅
- Redis commands in the console. ✅
Another Redis Desktop Manager: the Middle Ground
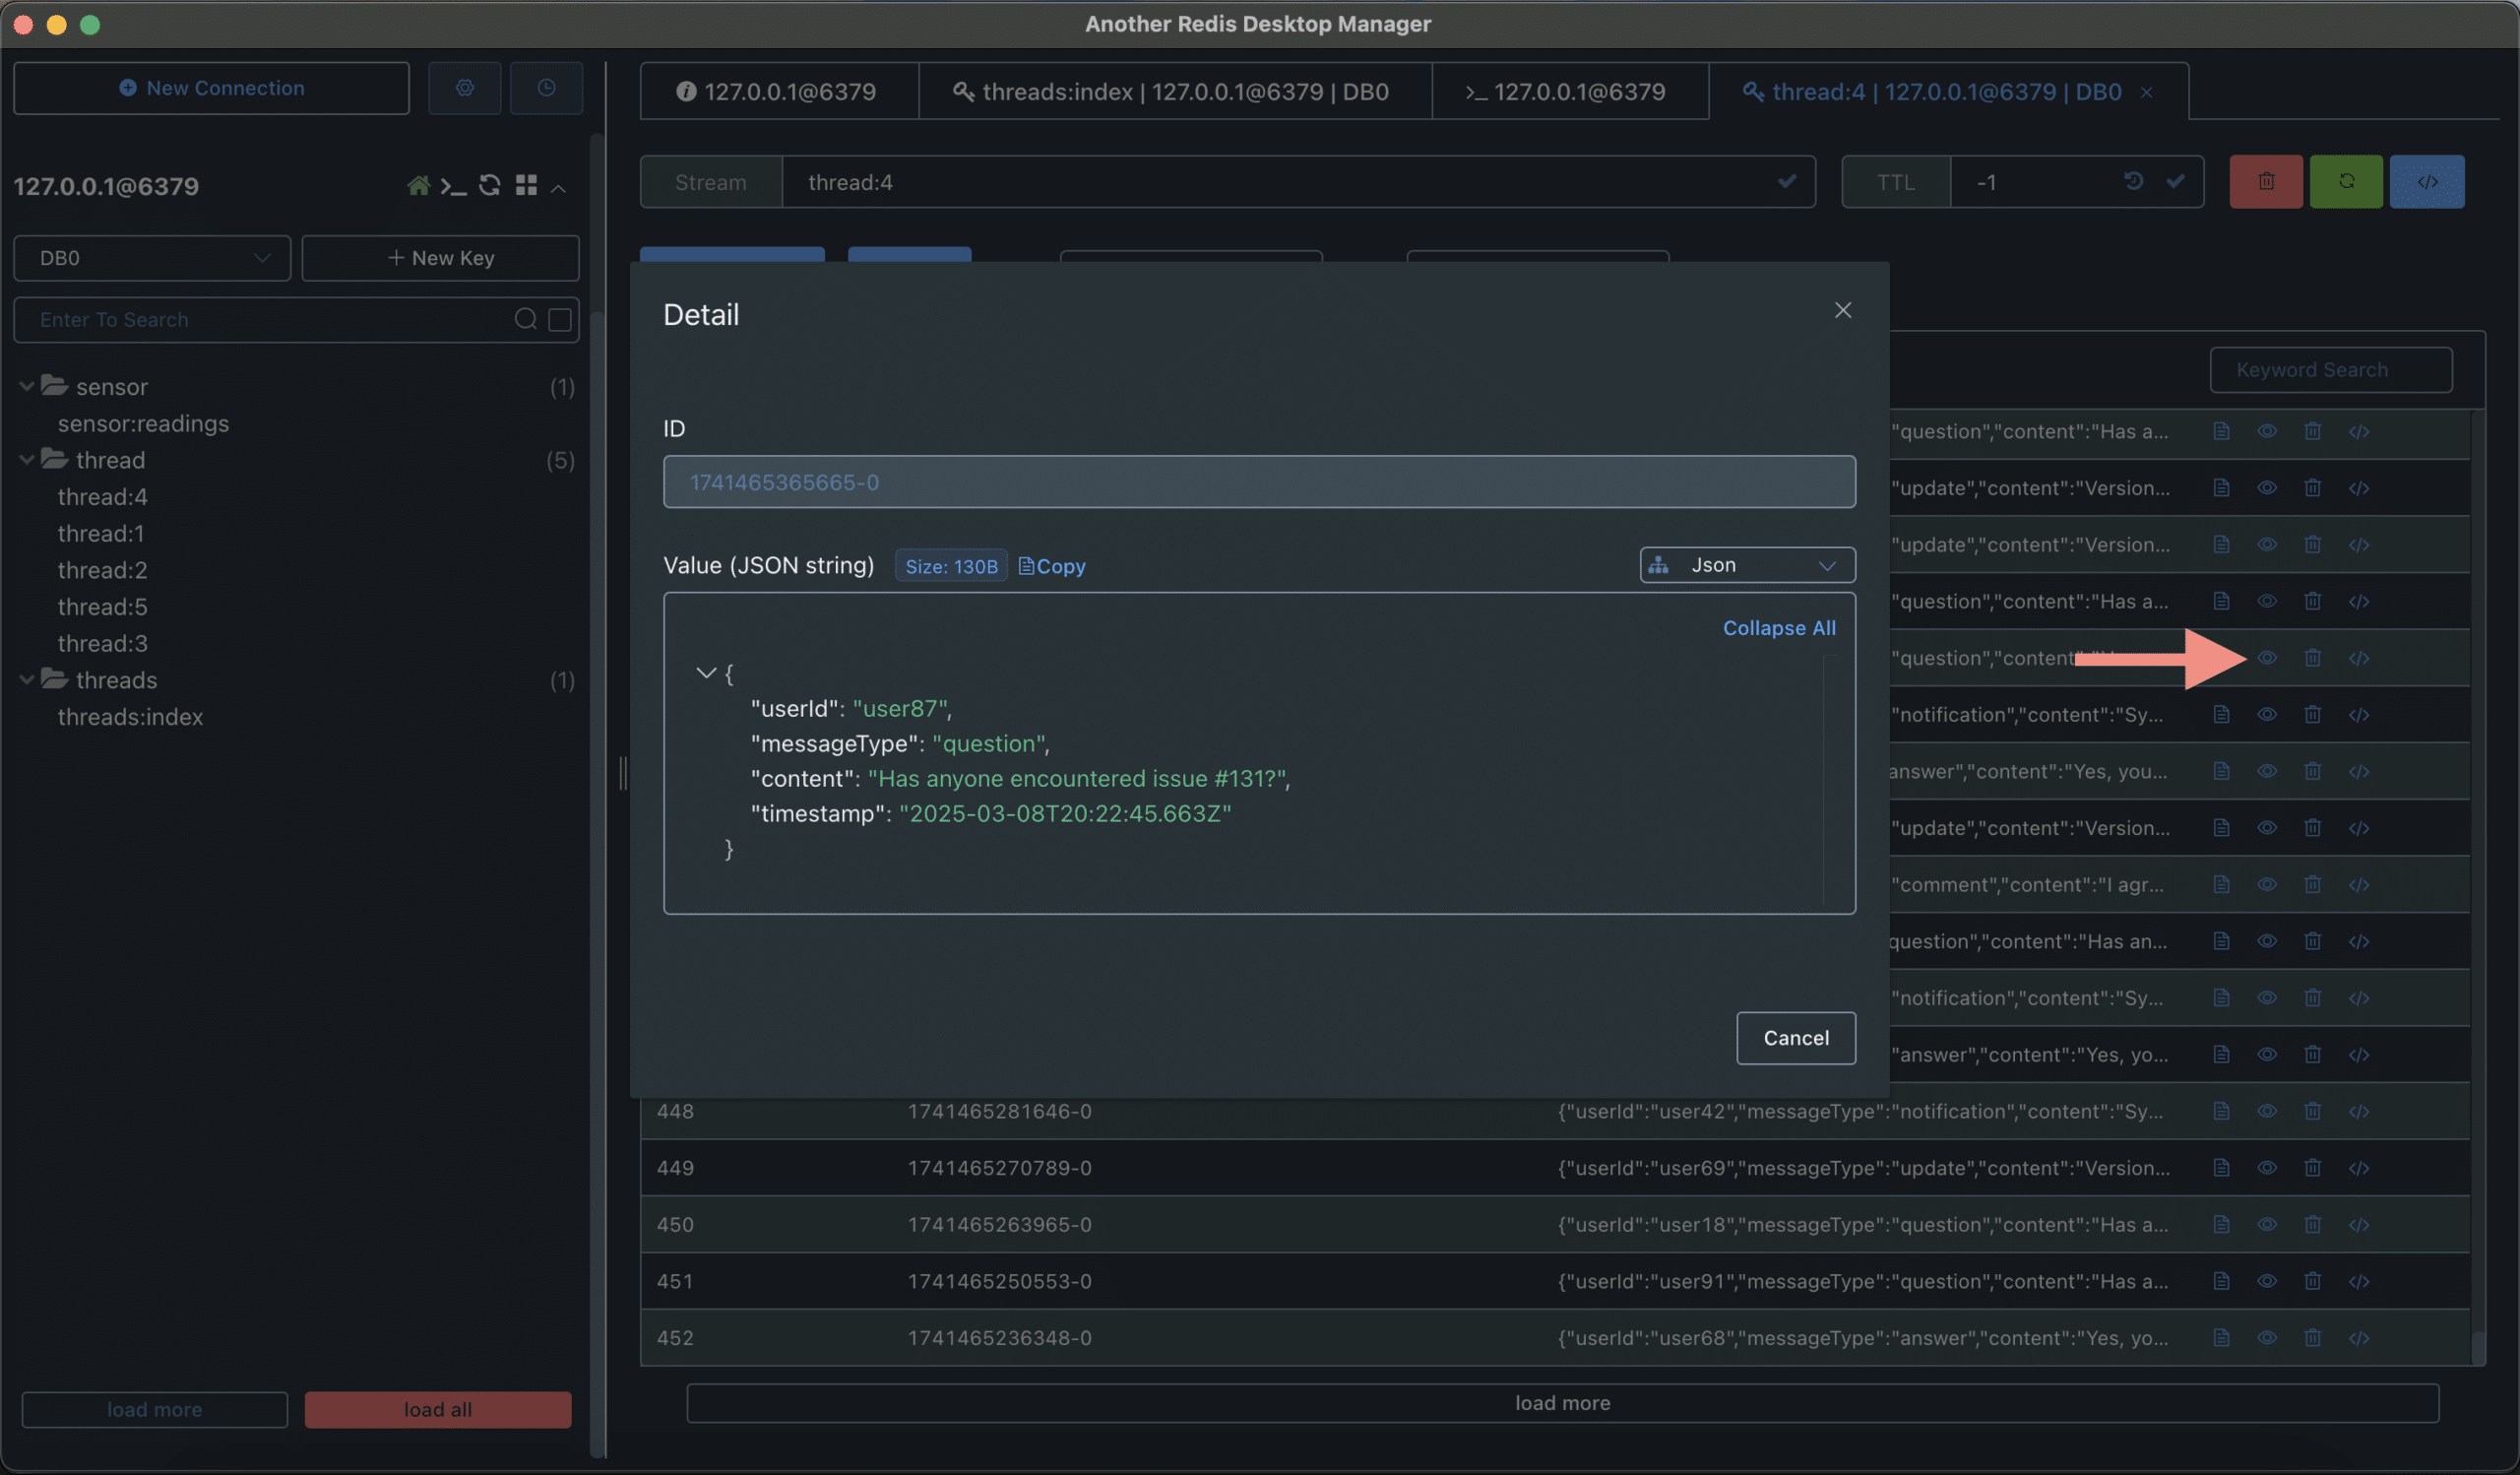
Another Redis Desktop Manager runs on Windows, Linux, and macOS. Despite the name needing some serious work, it’s an excellent Redis GUI for looking at streams. Take a look at the interface:
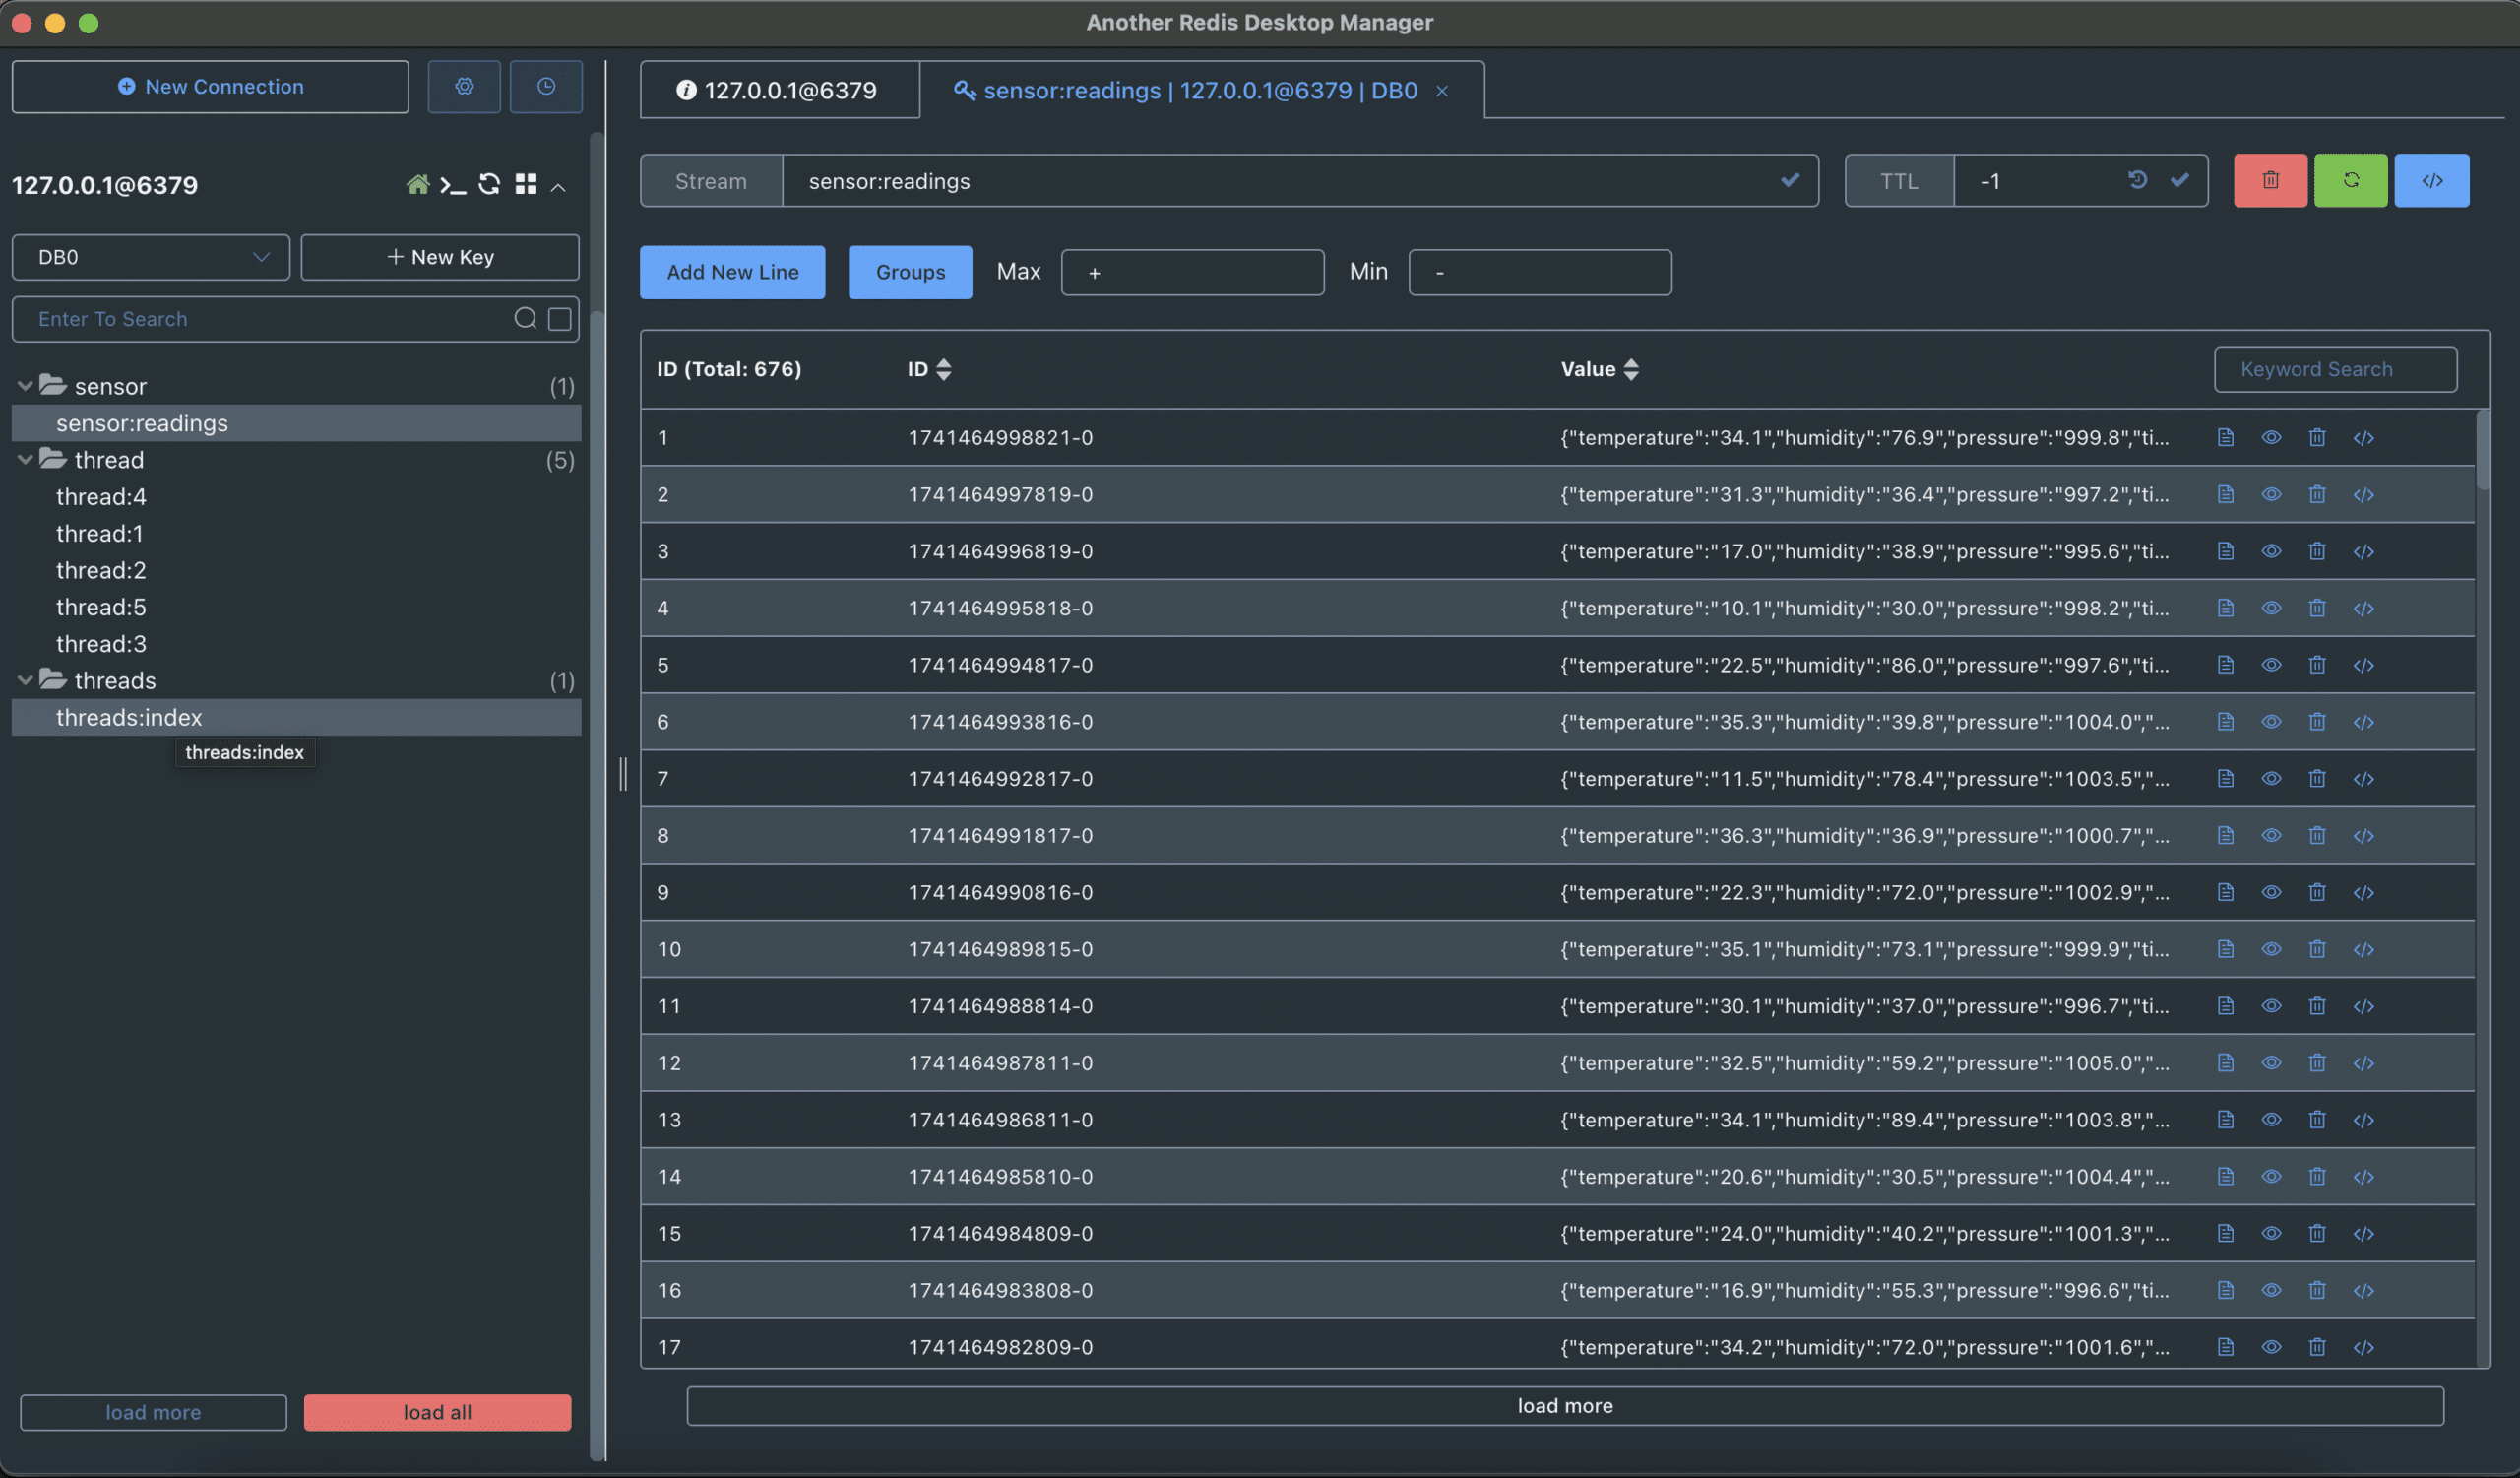
First, look at that folder structure. I can see the associated streams (e.g., thread and thread:1) and their entries. Second: it’s a clean, mostly intuitive interface with dark mode support. Tabular rows are alternating colors, making it easy to scan the data.
Like Redis Commander, ARDM preserves the stream structure of Redis streams, making it easier to understand the relationships between streams and their entries. Unlike Redis Commander, ARDM allows me to expand the stream to see all entries (all of them), and it has a search bar to find specific entries.
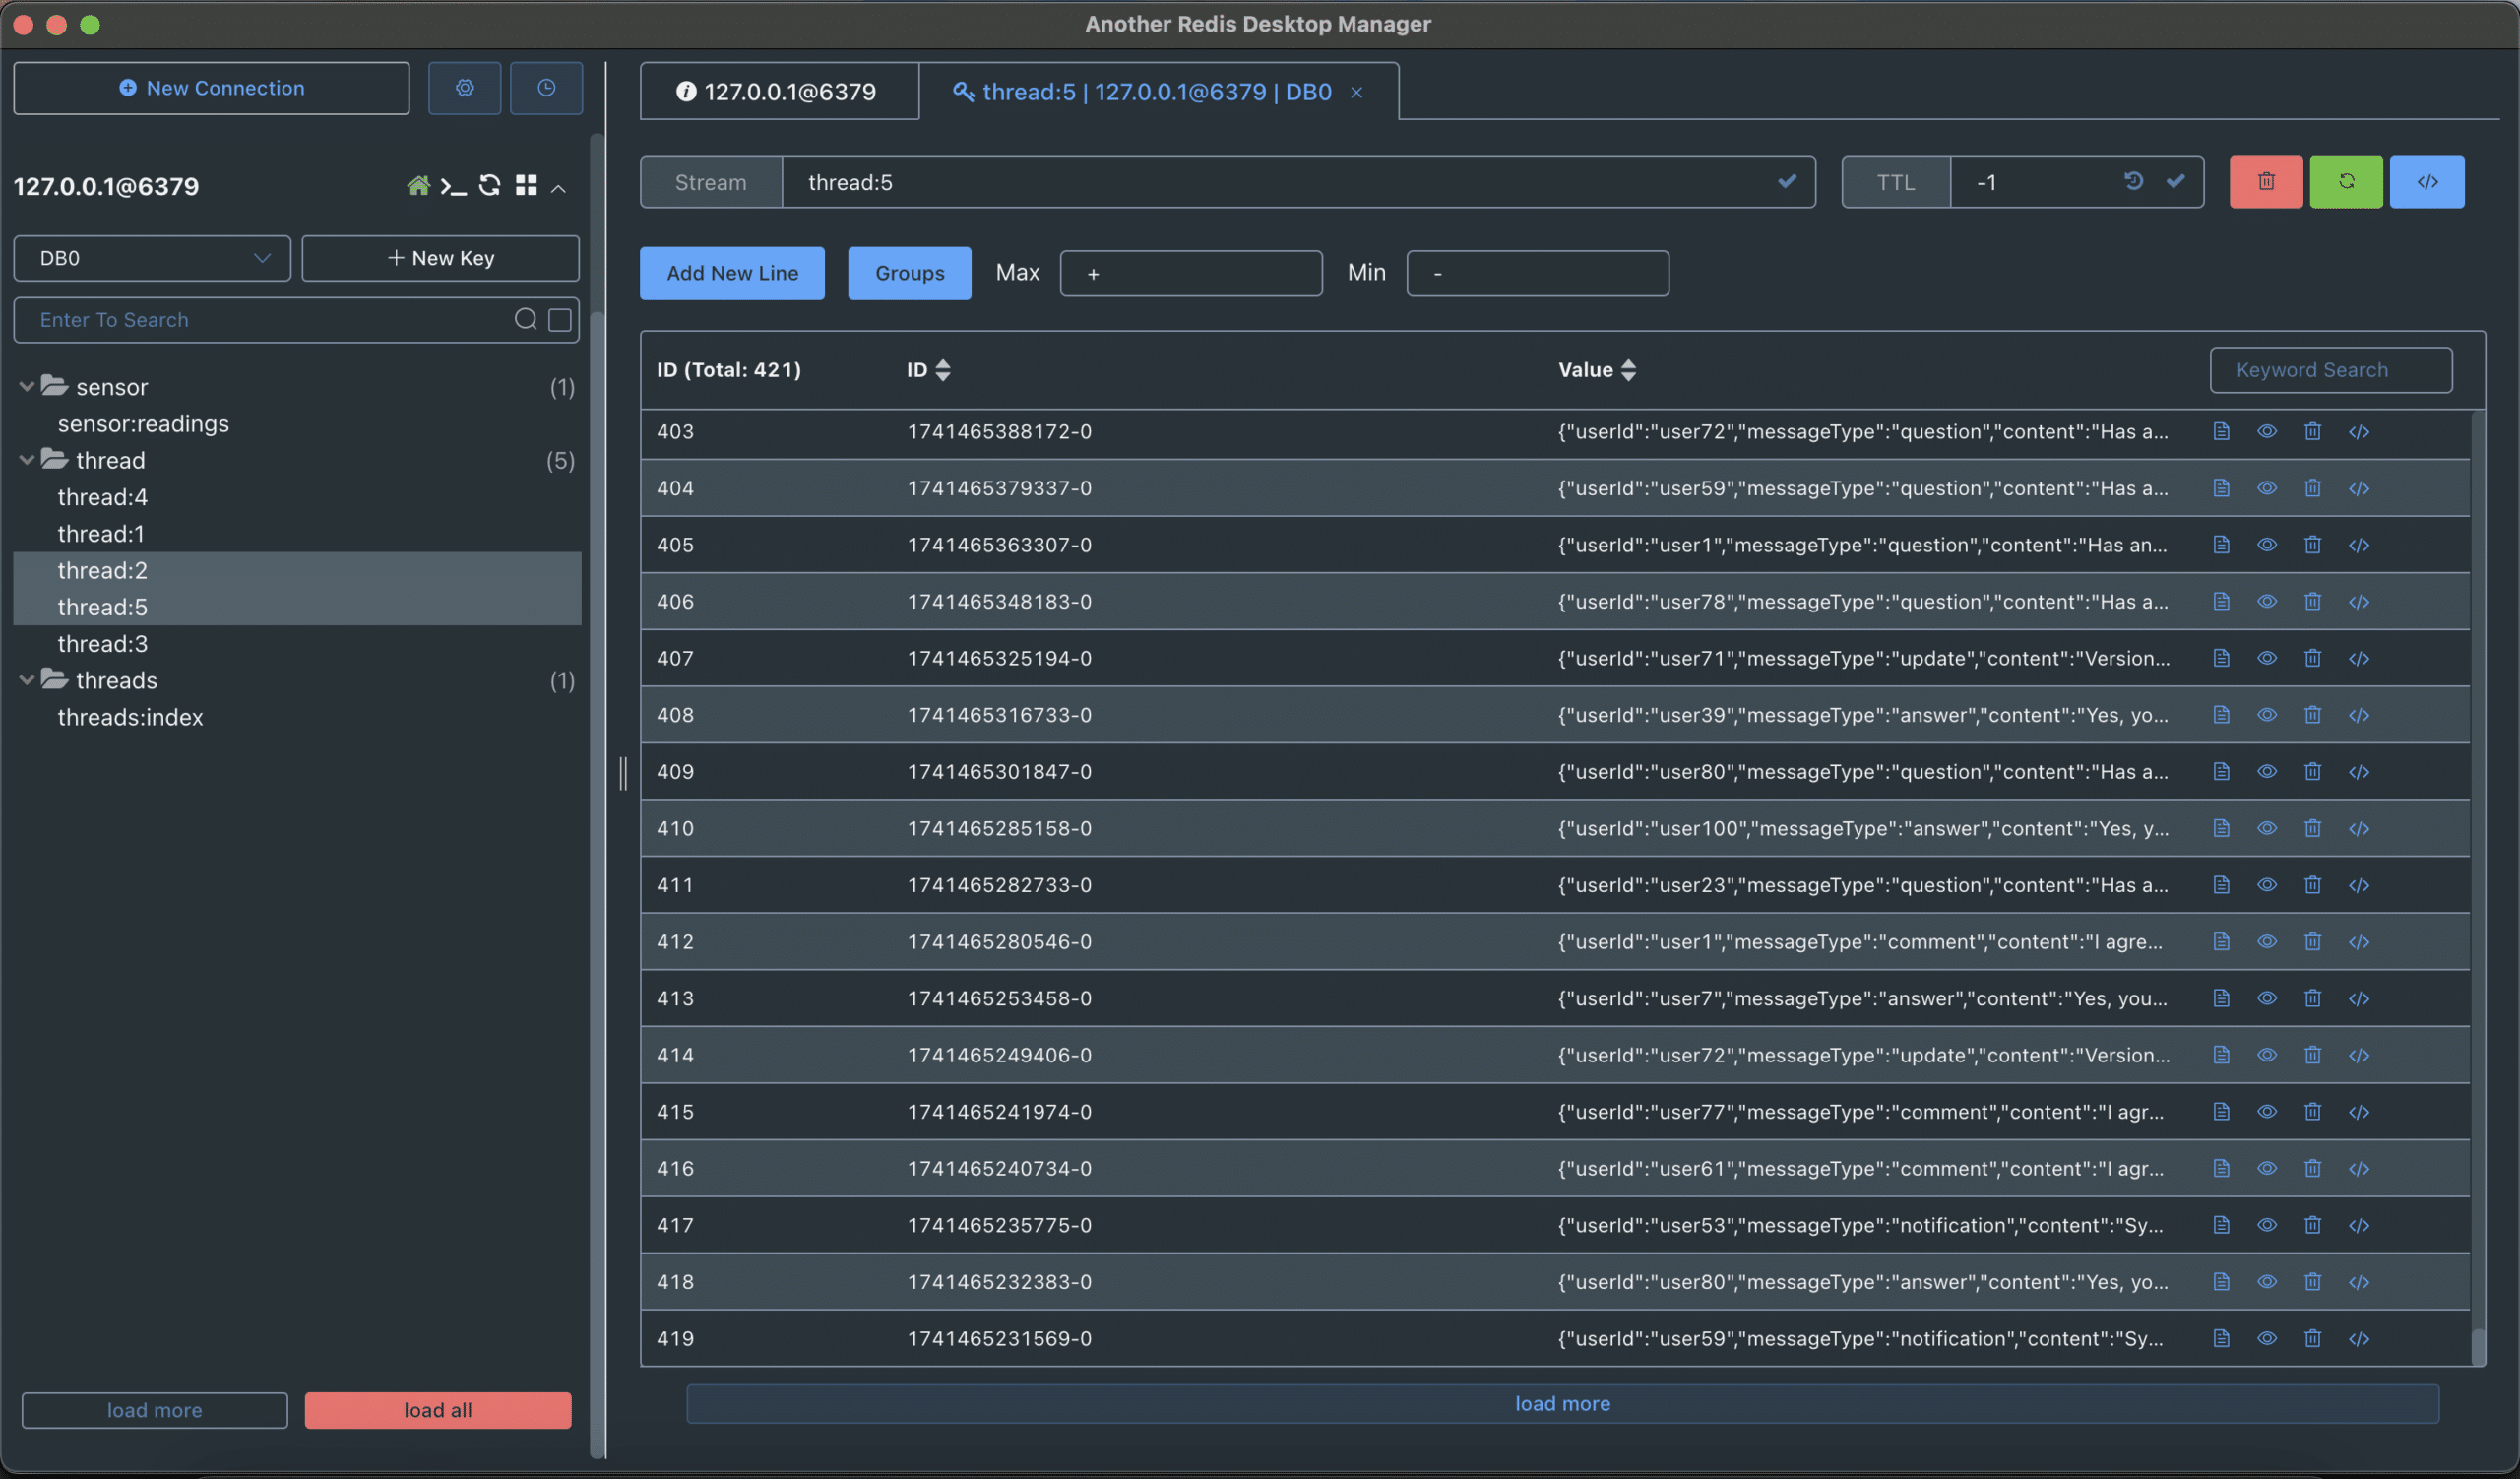
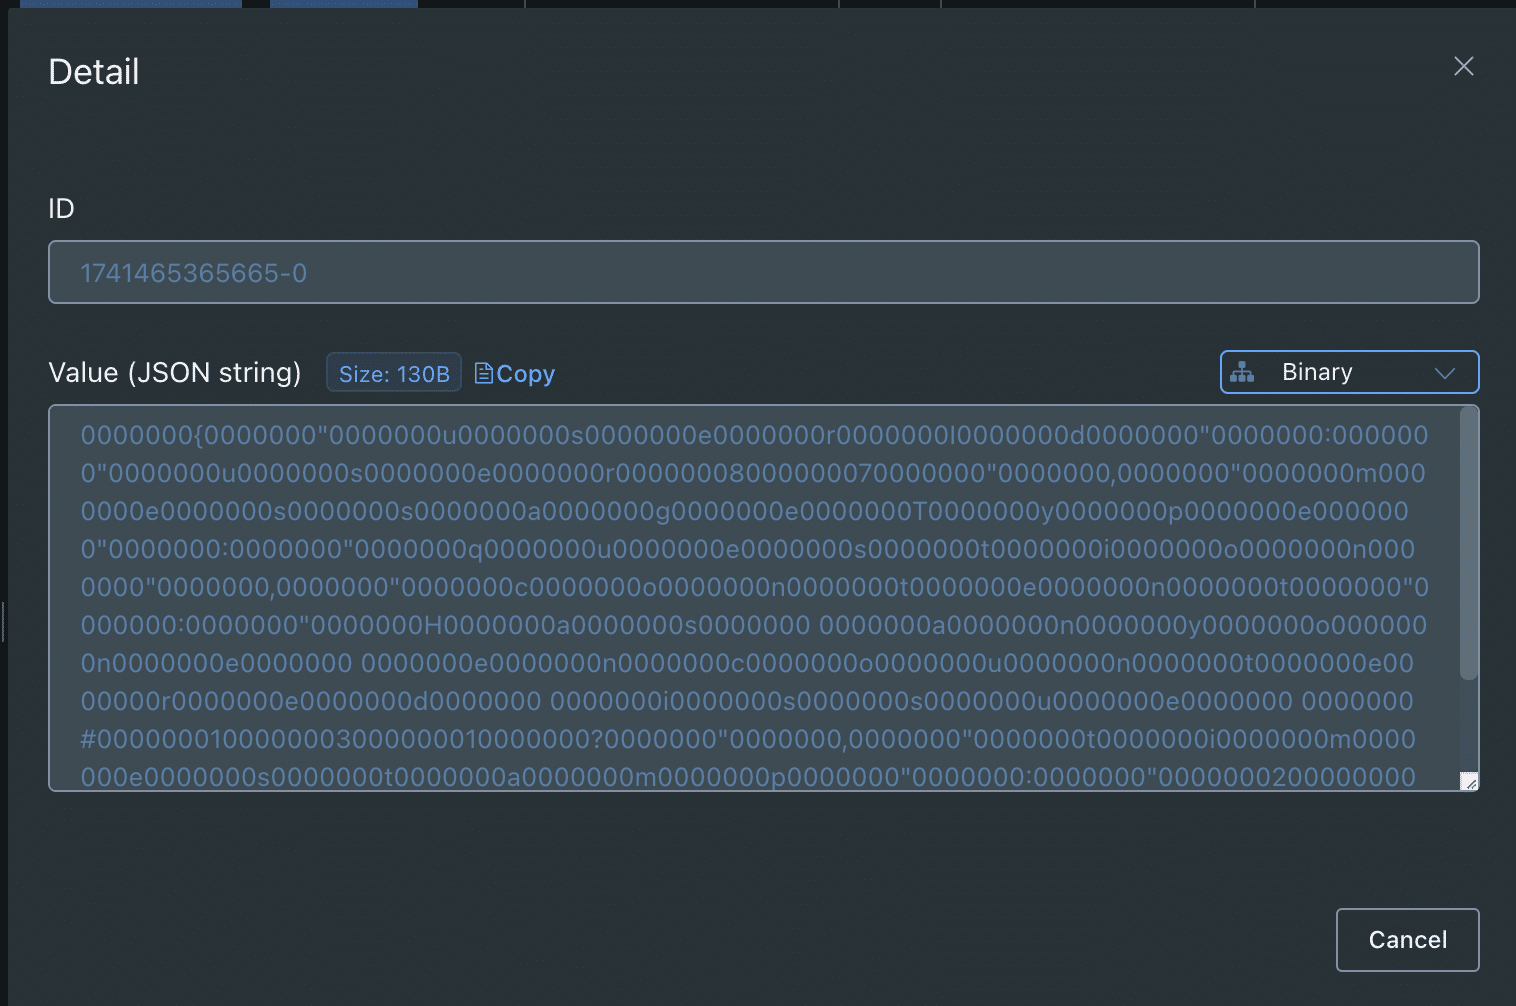
Clicking on an entry’s eye icon opens a modal with the full JSON string, making it easy to inspect the data. Should JSON not be your desired format, ARDM allows you to view the data in text, binary, etc.
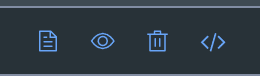
Another really cool feature of ARDM is the utility icons next to each entry. These allow the user to copy and delete entries, and also give the exact Redis command needed to recreate a specific entry.
Clicking on </> will yield something like this:
XADD "thread:4" 1741465324163-0 "userId" "user32" "messageType" "notification" "content" "System maintenance scheduled for 2025-03-09" "timestamp" "2025-03-08T20:22:04.160Z"
Takeaways:
- Free unless you download it from the appstore 🤷. ✅
- Desktop application. ✅
- Handy tool icons. ✅
- Very good visualization. ✅
- Redis commands in the console. ✅
- Name. 😐
RedisInsight: the Power Tool
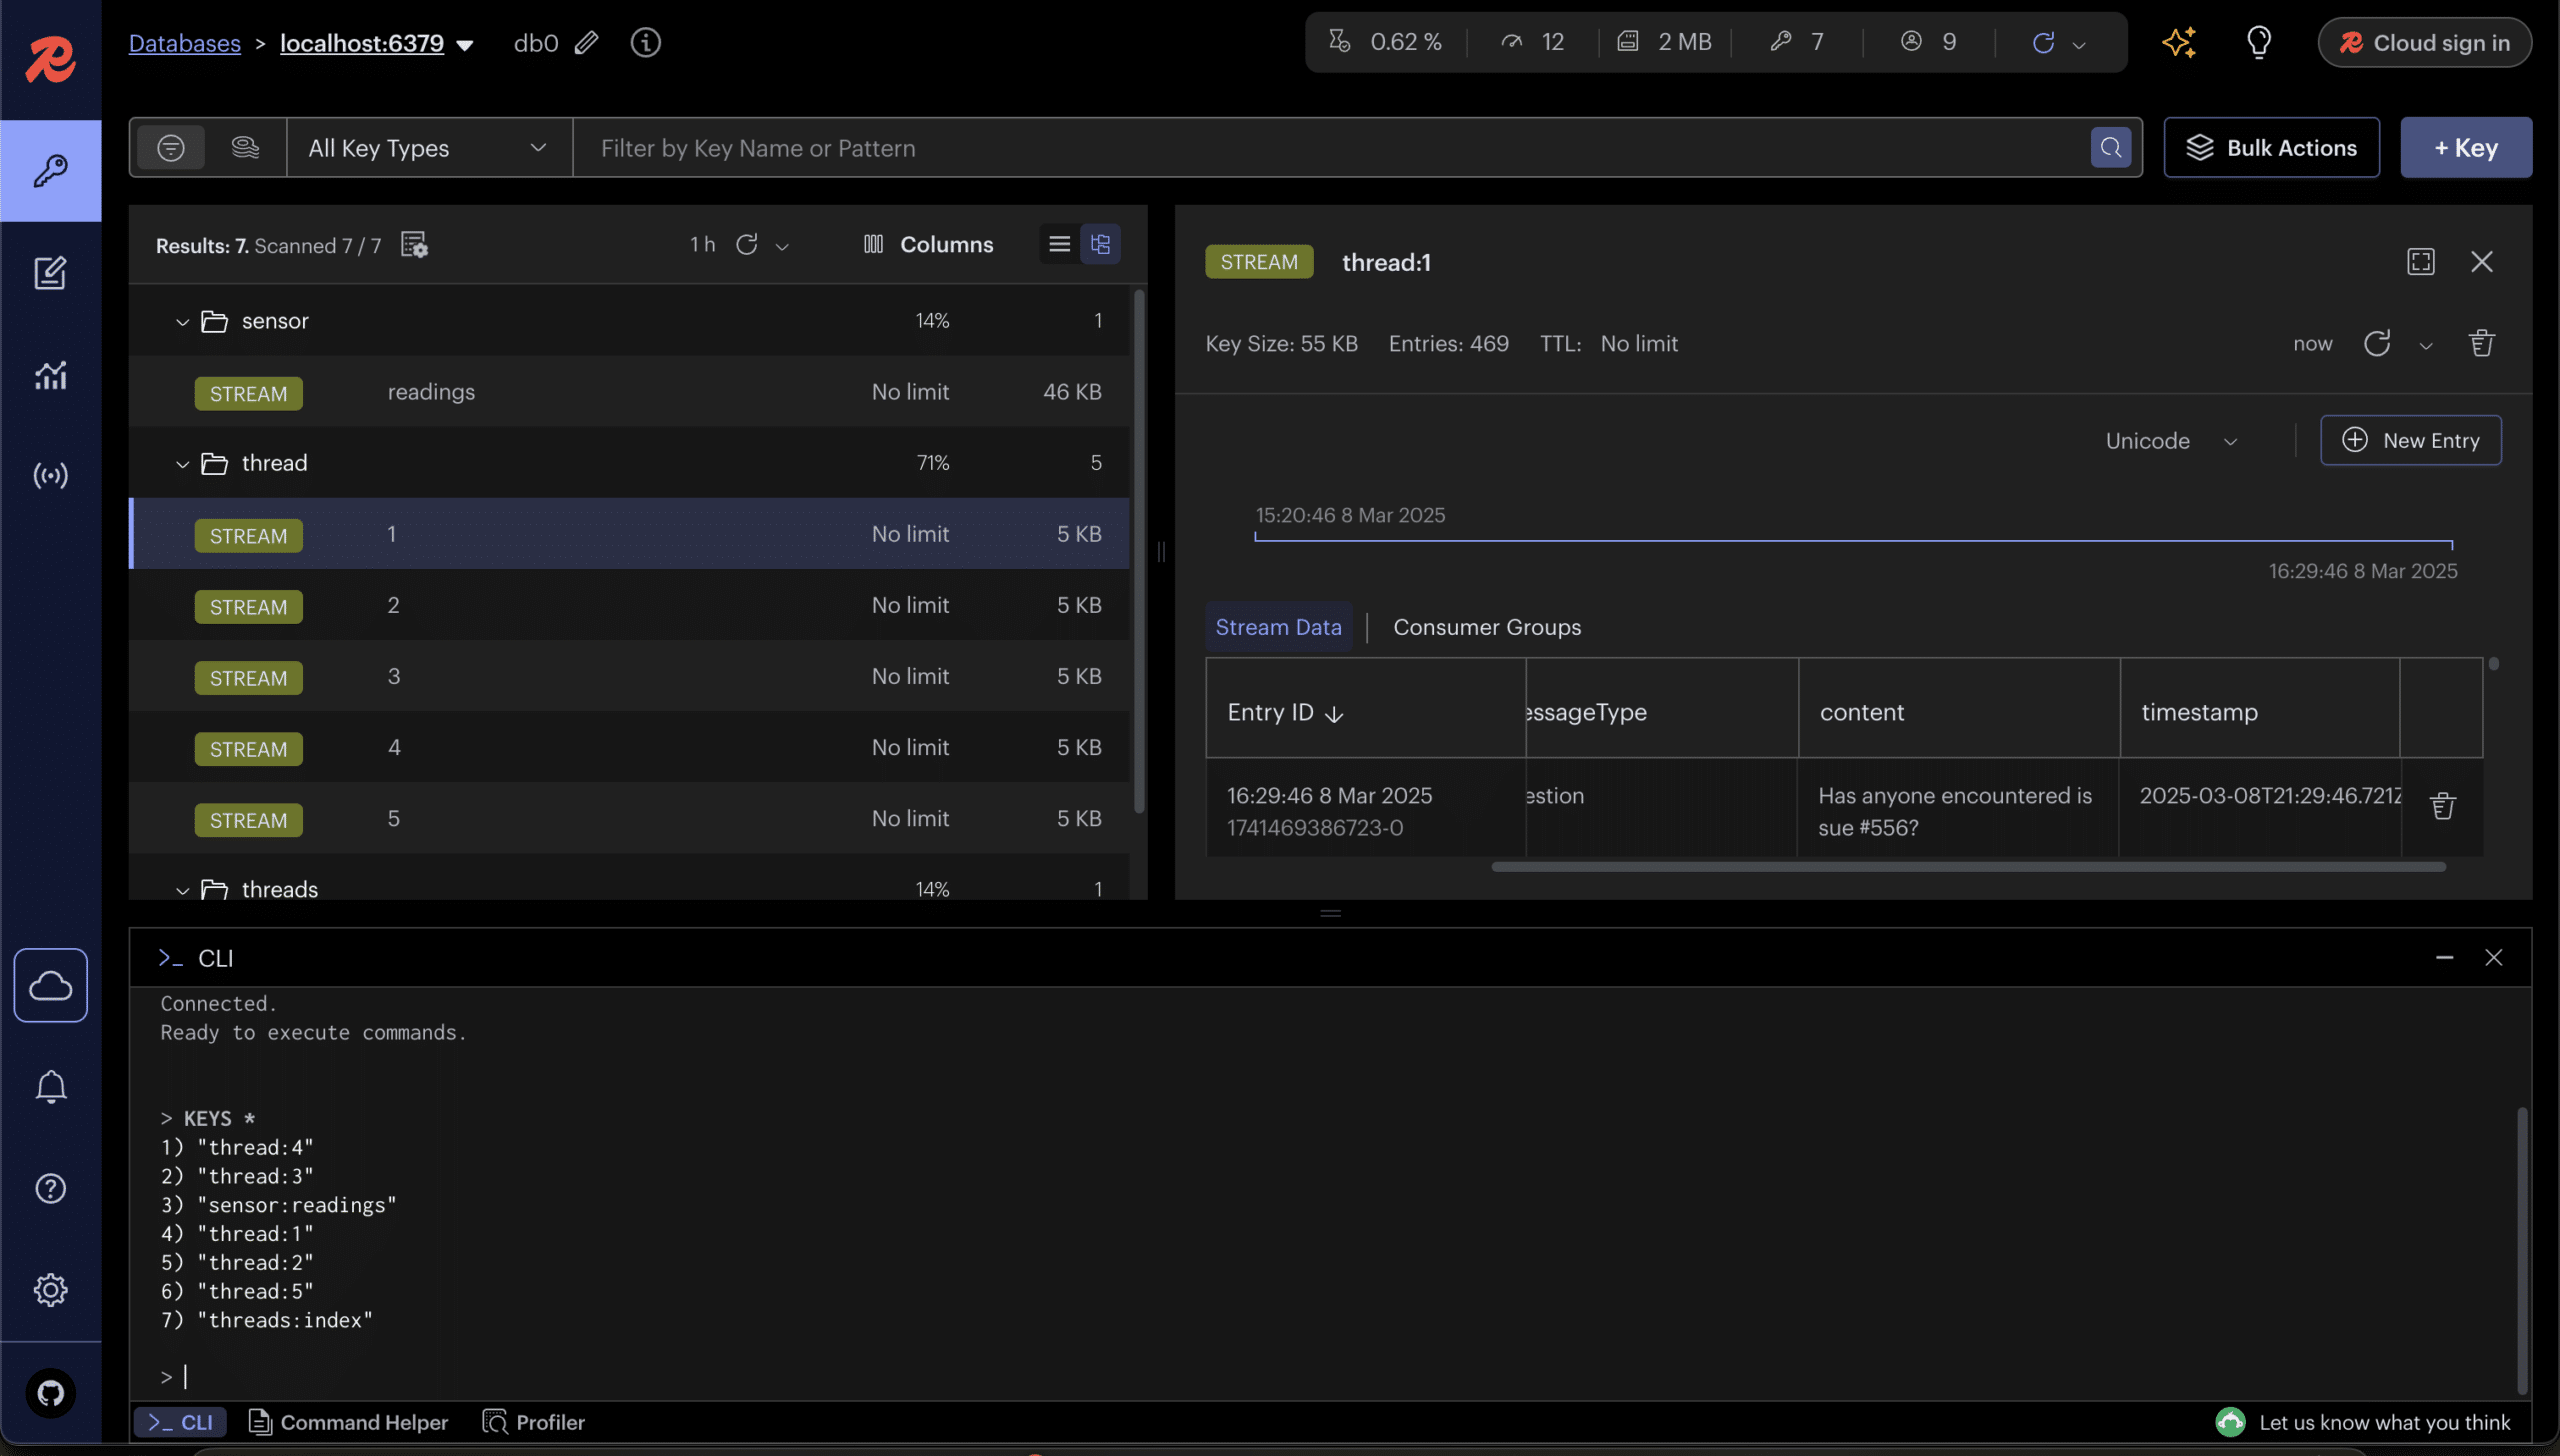
RedisInsight is Redis’s official GUI tool. The tool has a clean, pleasant UI and offers the same data visualization as Another Redis Desktop Manager.
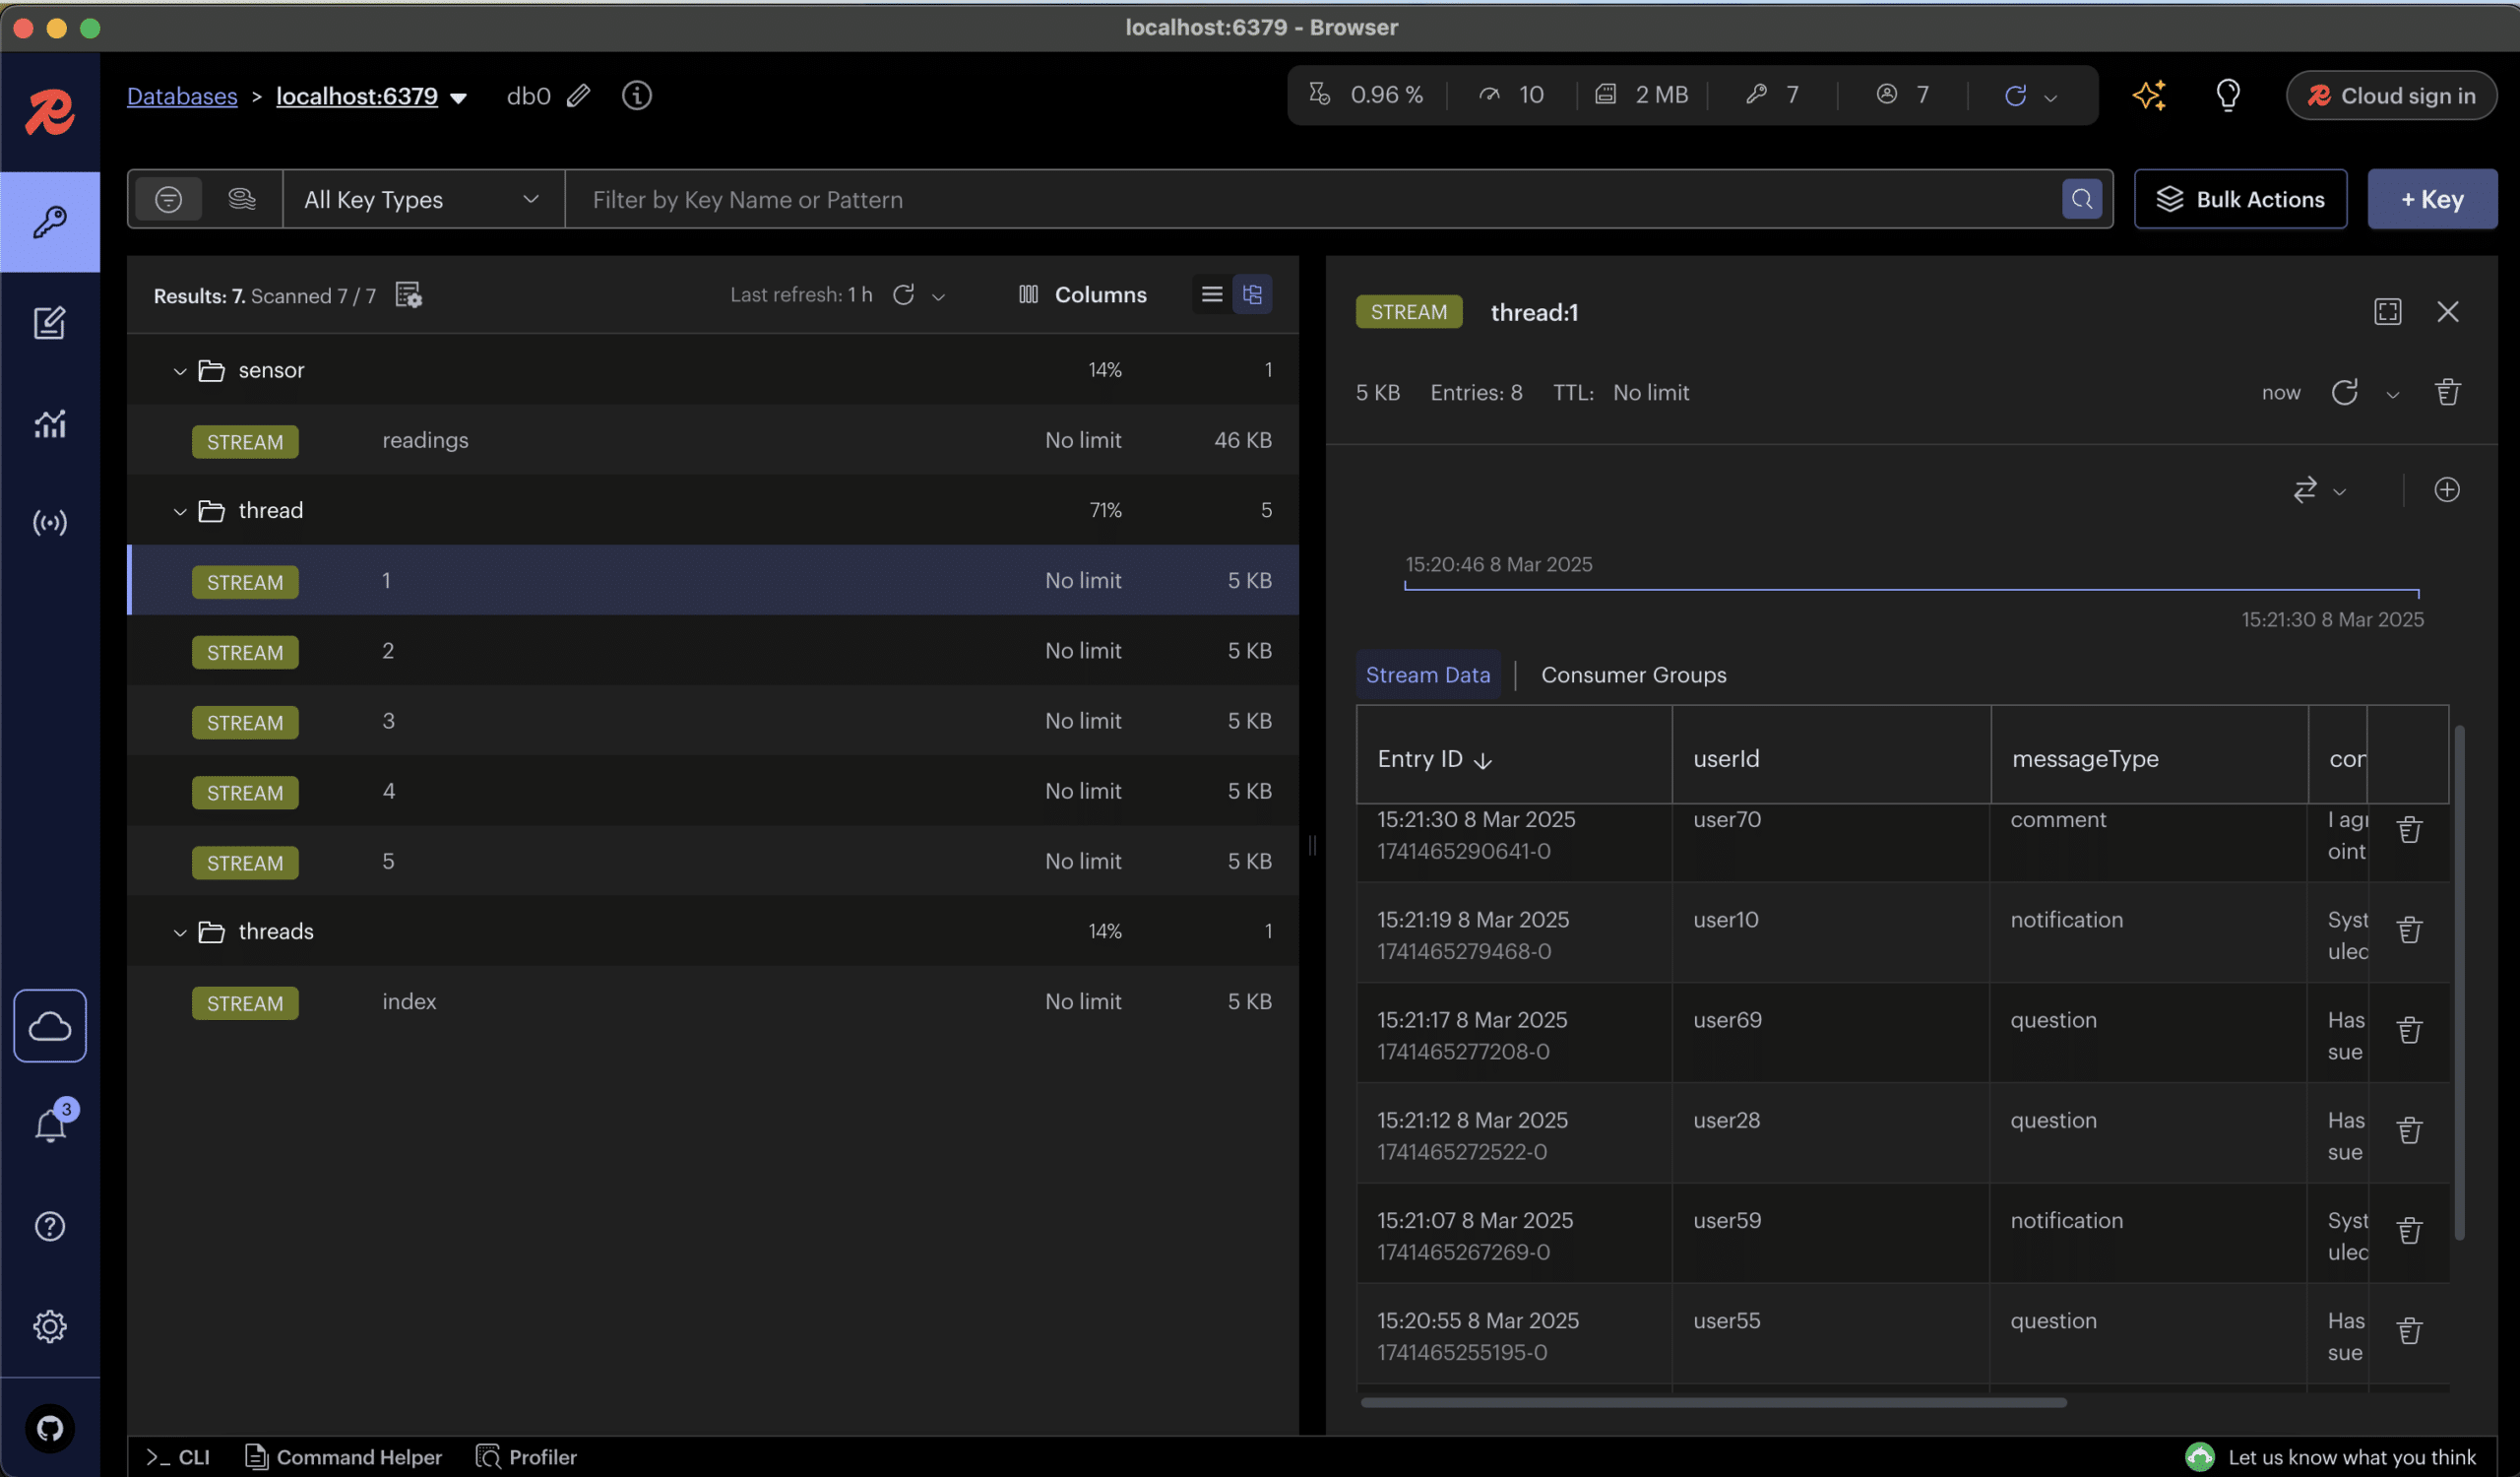
I especially like the label `STREAM` here, and the tabular rows with alternating colors. RedisInsight offers an appealing UI.
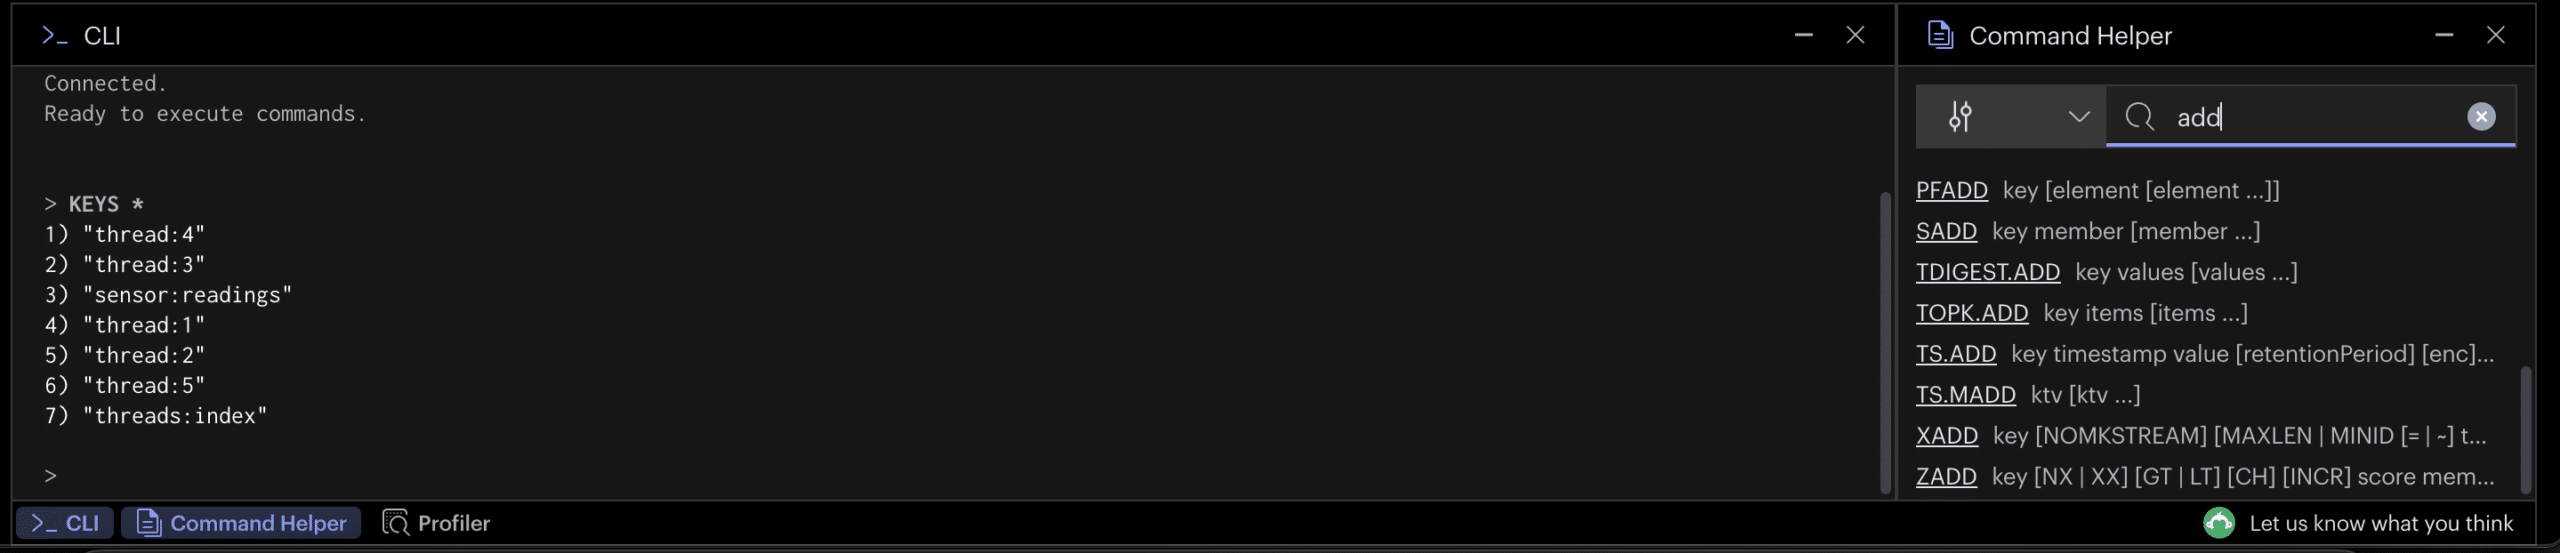
Like all the other Redis visualization tools, RedisInsight allows a user to compose Redis commands, and has a Command Helper tab to look up commands without leaving the UI:
Other cool functions include time-series visualization, memory analysis tools, performance profiling capabilities, and bulk operations. RedisInsight, by far, is the most productionalized Redis tool of the four.
On a more persnickety note: I’m not a huge fan of the horizontal scroll in the stream data view (rightmost section) below:
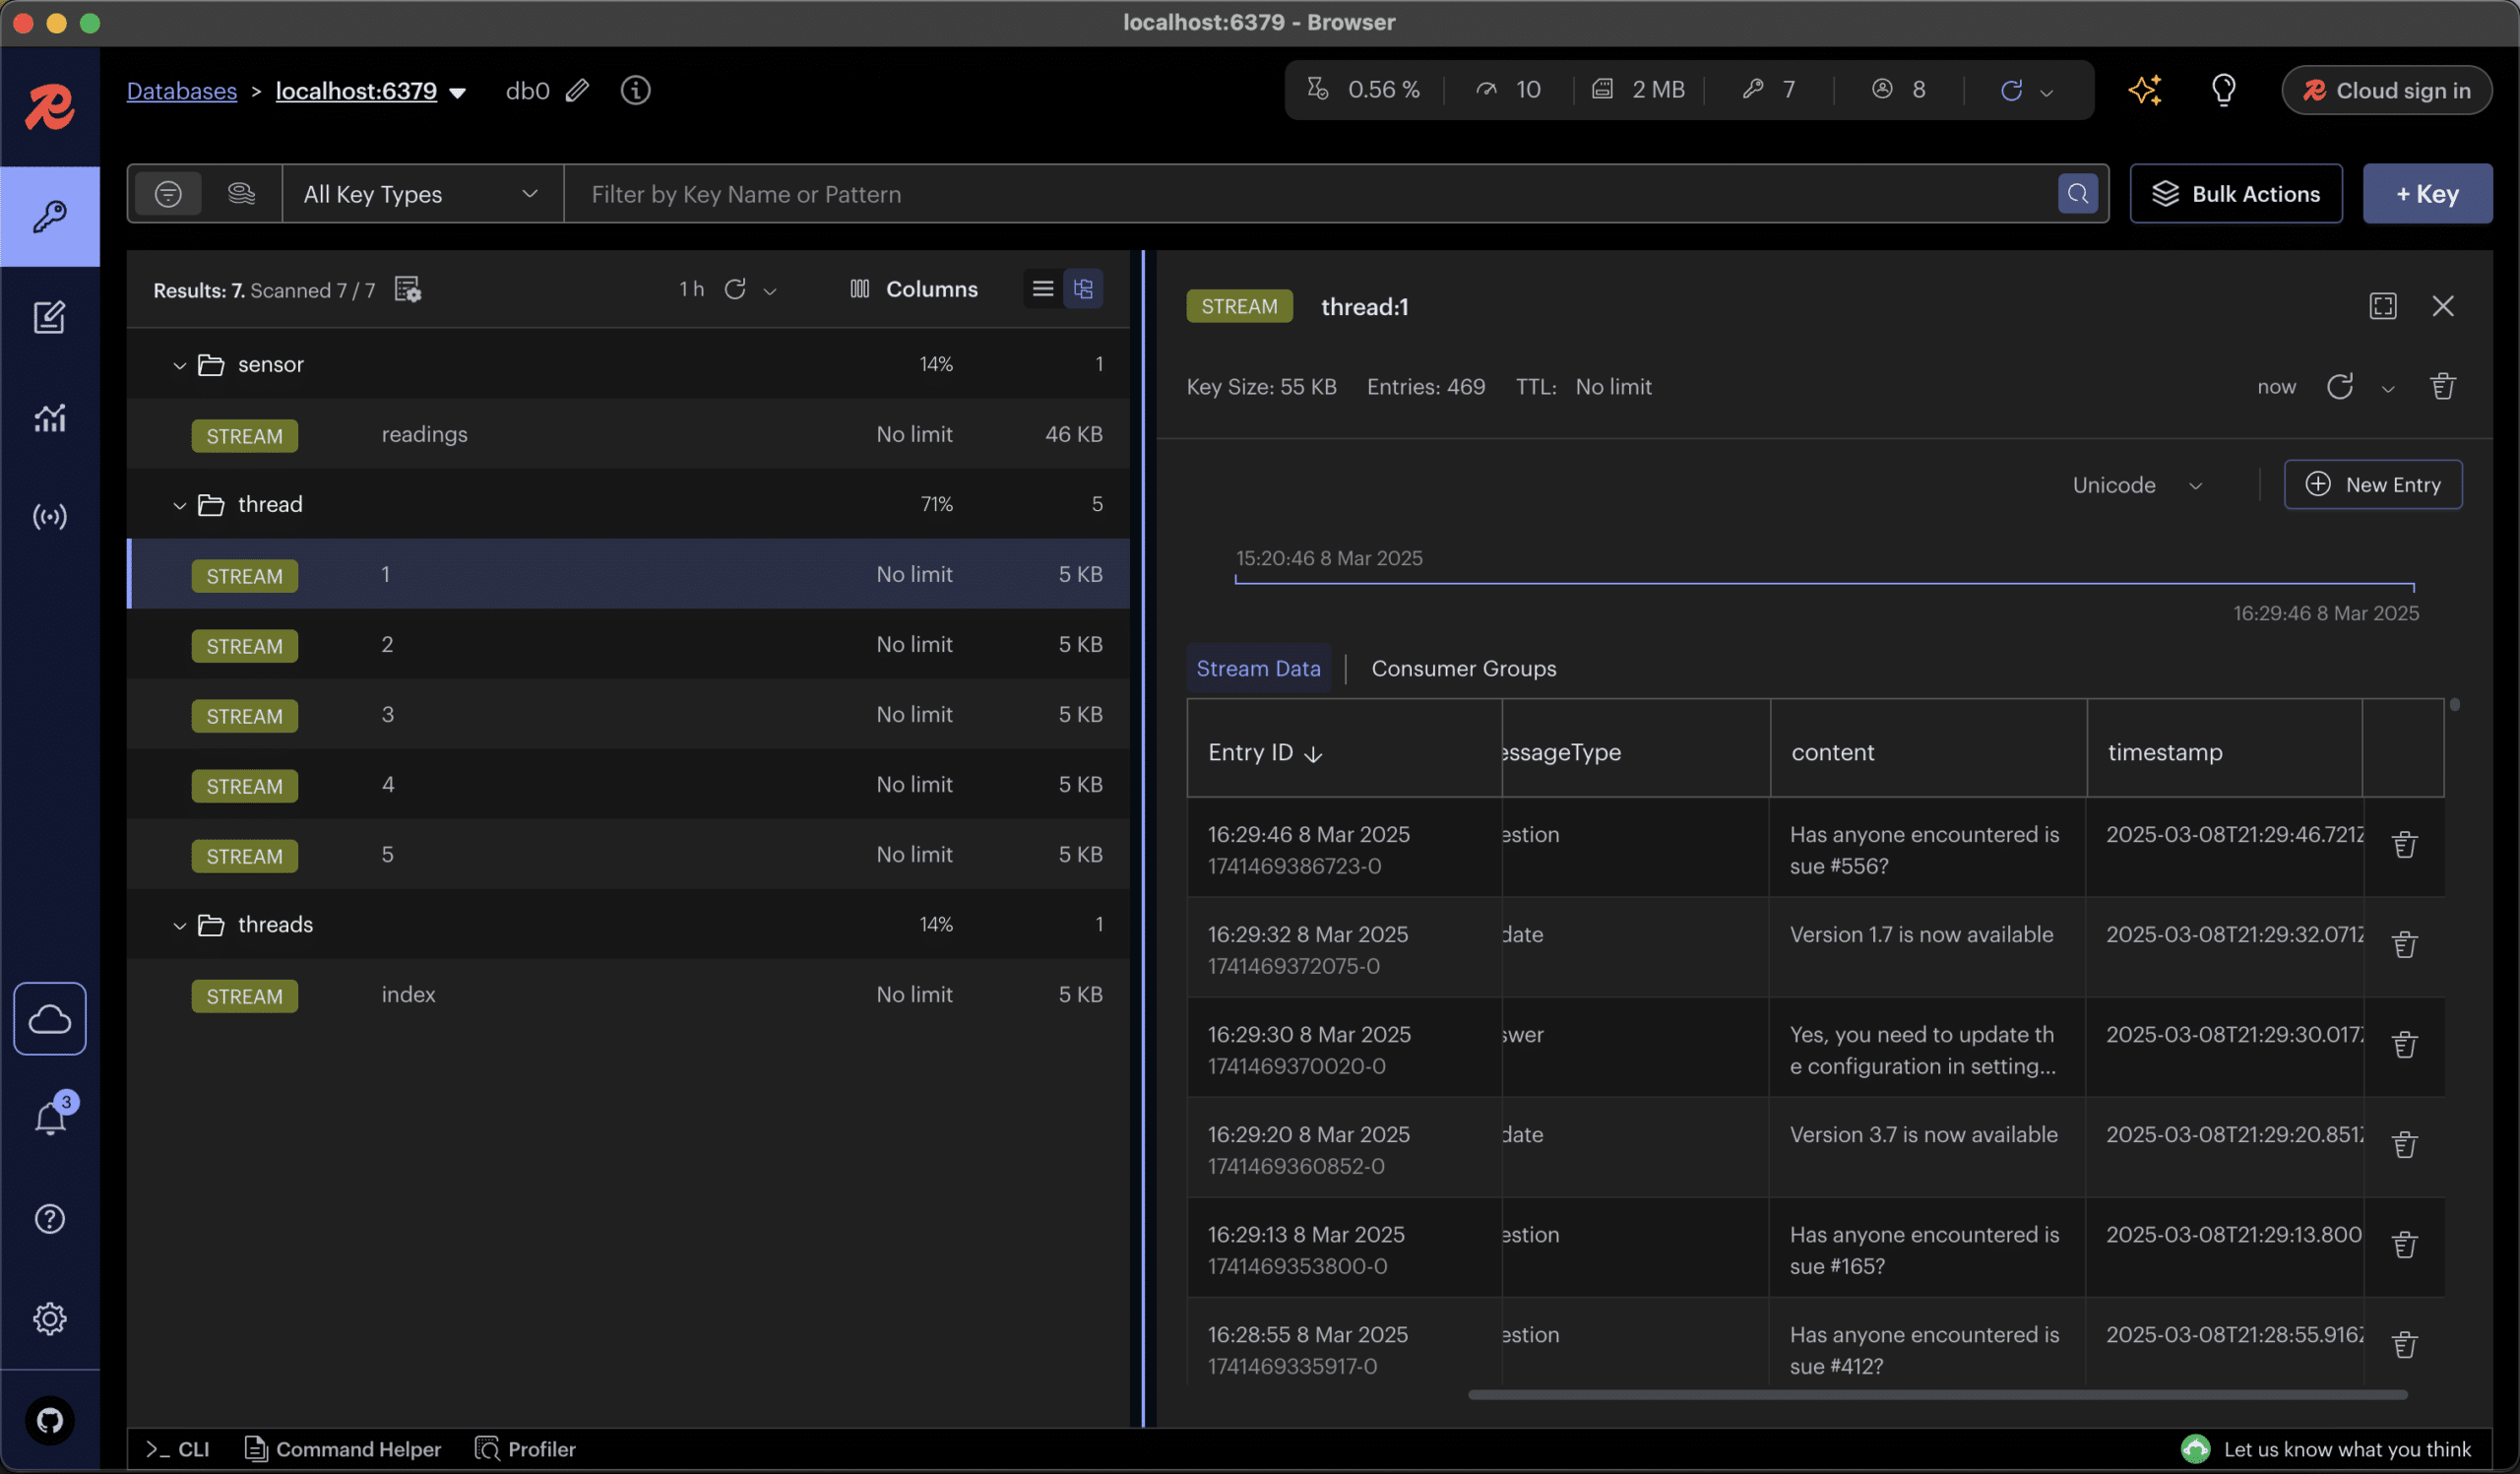
Comparing this visually, RedisInsight doesn’t give me as much breadth of information at first glance like Another Redis Desktop Manager does. By making each column an entry value’s properties, they actually made the UI less informative. The columnar approach creates unneeded horizontal scrolling for entries with numerous fields, reduces the visible entry count per screen, and obscures the hierarchical relationship between entries and their properties.
ARDM’s nested property view more efficiently displays the complete structure of each entry, allowing users to immediately grasp both the entry’s ID and all its associated properties without sacrificing context or requiring additional interaction.
Takeaways:
- Free tier download with sign up. ✅
- Desktop application. ✅
- Production-grade. ✅
- Mostly good visualization. ✅
- Redis commands in the console. ✅
- Columnar approach to stream data view. 😕
Making your choice
For my purposes, I’ll keep using ARDM when I want to visualize Redis streams, and Redis Commander as a backup. Should I need a more powerful tool in the future, I’ll look to RedisInsight. And, TablePlus I’ll use to view my Postgres data.