At Atomic, burn charts are an important component of our project management practices.
A Burn chart is a high-level visual indicator that reveals project progress over time. Generating these charts at regular intervals provides key insights for both the business customer and the development team.
Some of these insights include:
- Confidence about delivery dates
- Confidence about anticipated cost
- Impacts of scope change
- Measurement of accomplishment
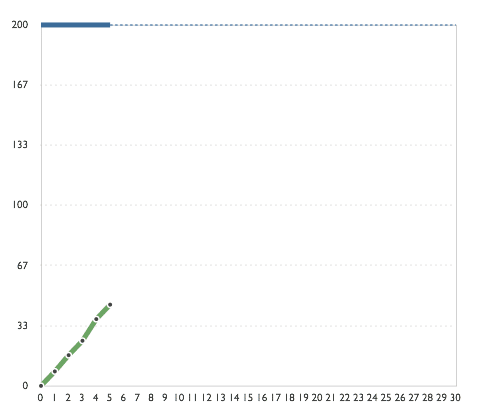
There are many ways to visually represent a burn chart. At Atomic, the burn charts that we create resemble the following chart.

This burn chart is composed of the following components.
Vertical Axis – Work that needs to be done.
Horizontal Axis – The time the project requires.
Blue Line – Represents the total project scope (200 points).
Green Line – Represents the amount of scope done (48 points).
In the above example, the team has worked for five iterations (consistent time increments). Everyone is visually able to see that progress is being made.
Measuring how much work is done for each iteration also allows us to measure the team’s velocity.
Note: At Atomic, when calculating velocity we use a weighted average formula to give precedence to the previous iteration.
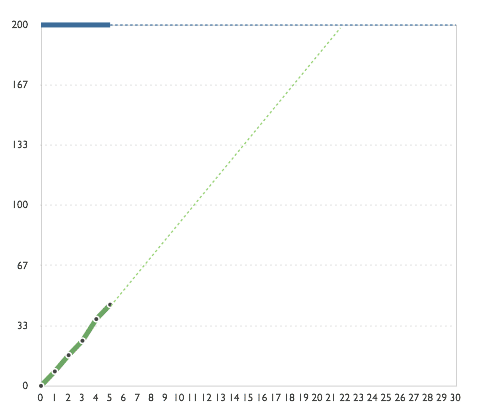
If we want to determine the projects completion date we can extrapolate the green line until it intersects with the blue line.

Based on our current velocity we will finish this project after 22 iterations.
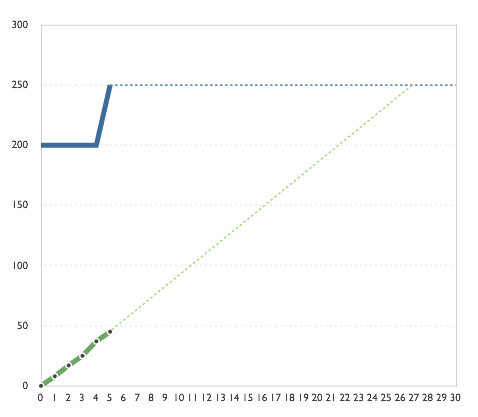
If new features or additional scope is required (50 additional points) we can adjust the top blue line and extrapolate a new completion date.

Finally, if the above project is constrained by a calendar date (it must be complete by the 15th iteration) the burn chart can help determine how much scope needs to be removed or how many people need to be added in order to release on time.
Note: Brooke’s law states, “Adding manpower to a late software project makes it later”. In our experience, adding more people to an existing project temporarily slows down the team’s velocity. This happens because time is required from existing team members to ramp new team members into the application. We have found that if the project is well tested and properly decomposed the additional manpower will quickly learn the code base and increase the team’s velocity.
Since the burn chart can reveal a delivery date mismatch early in the project, the business has an opportunity to quickly make a course correction.
