Browser DevTools, or Developer Tools, provide web developers with powerful development capabilities. They enable quick editing, testing, and debugging of software in real-time. Best of all, nearly every modern browser includes DevTools right out of the box!
In the first part of this series, we explored the Inspector—a tool for examining and editing HTML and CSS in real time. In this second part, we’ll shift our focus to another essential feature of DevTools: the Console.
Accessing the Inspector
There are two easy methods to open your browser DevTools to access the inspector:
1. Right-click on any element on the web page and click on inspect. This should pop open your browser DevTools.
2. You can use the following keyboard shortcuts:
- Windows/Linux: Press
Ctrl + Shift + IorF12 - Mac: Press
Cmd + Option + I
If you have done all of this correctly, you should see something that looks like this:

In this second part of the DevTools series, we’ll focus on the Console tab—an essential tool that allows developers to log information, debug issues, and execute JavaScript commands directly within the browser. Think of it as an interactive terminal built right into your development environment.
Logging Information to The Console
Let’s see this in action! Let’s use the example React website that we created in the previous part of this series.

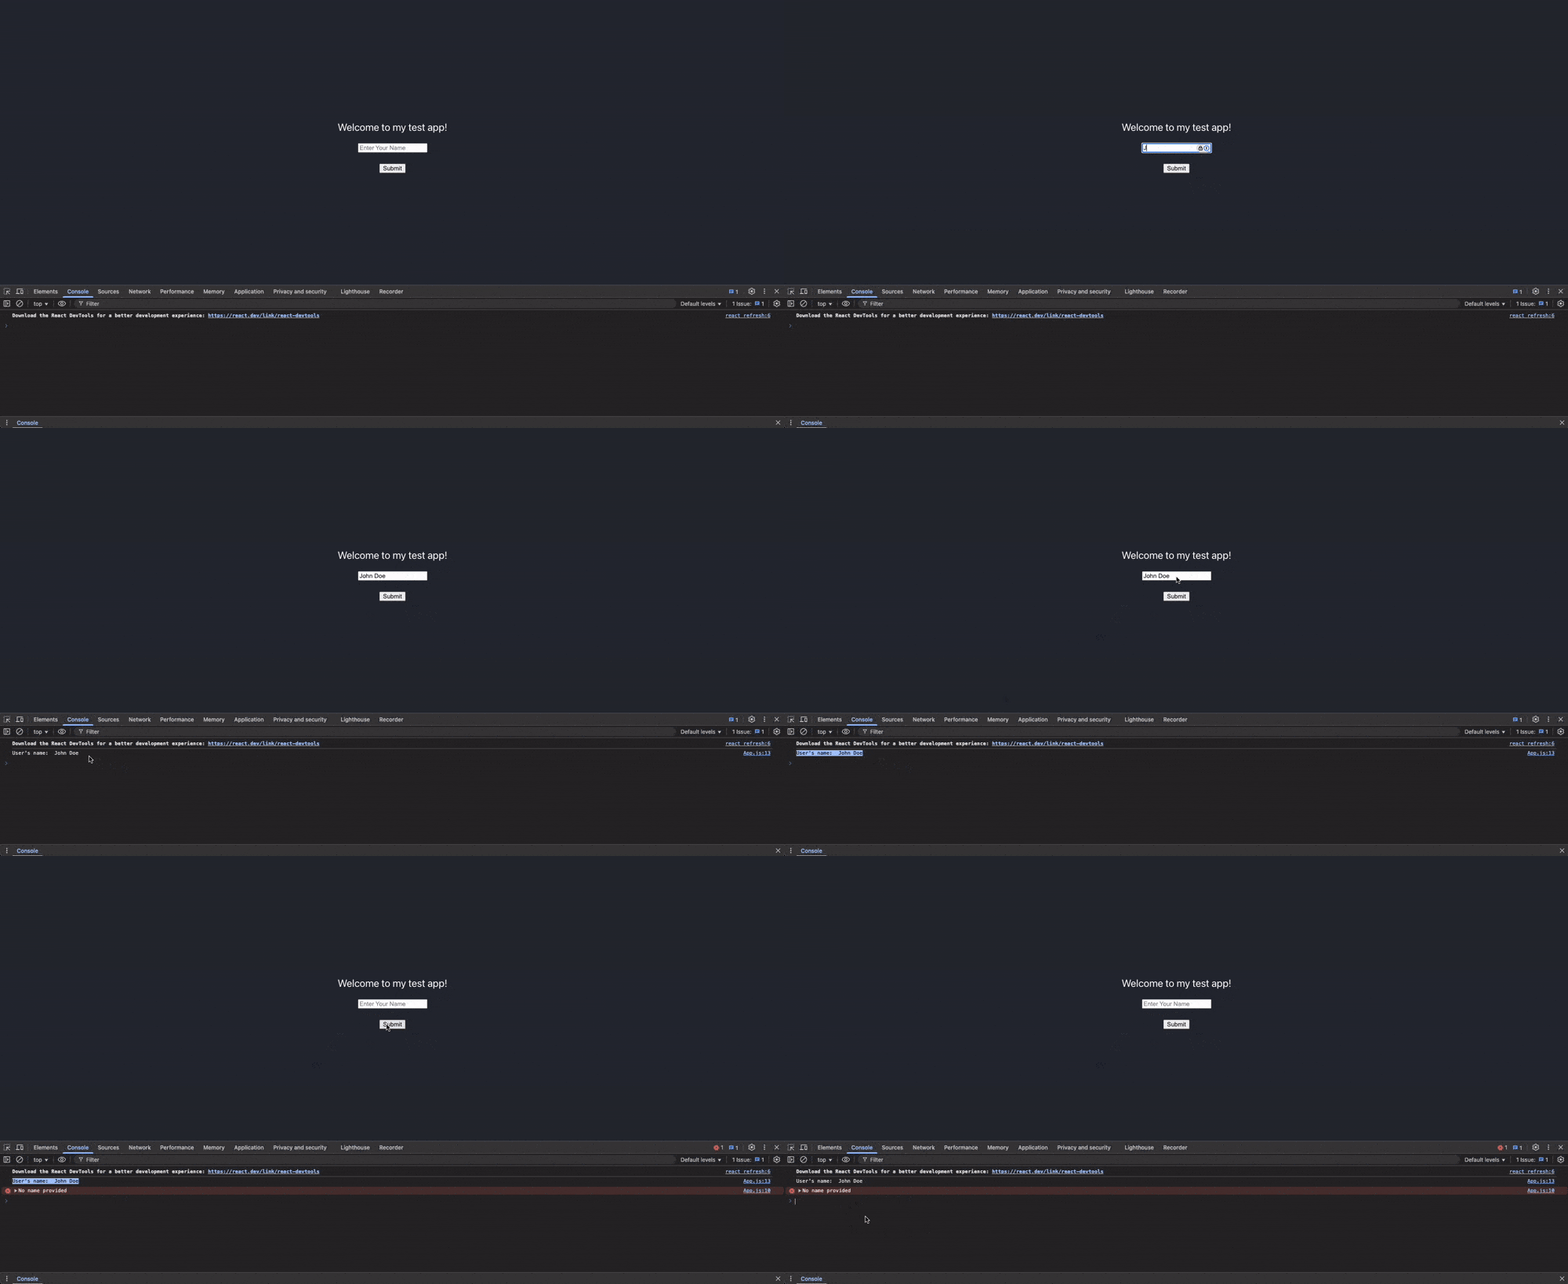
On our test website, we have an input field where users can enter their names. When they click the submit button, we want to log their input to the console for testing and debugging purposes. Let’s add that functionality to our code!
// app.js
import "./App.css";
import { useState } from "react";

function App() {
  // Add state to track the input value
  const [name, setName] = useState("");

  const writeToConsole = () => {
    if (name === "") {
      console.error("No name provided"); // If the user does not enter a name this error will be logged.
      return;
    }
    console.log("User's name: ", name); // If the user enters a name this will be logged to the console.
  };

  // Handle input changes
  const handleInputChange = (event) => {
    setName(event.target.value);
  };

  return (
    <div className="App">
      <header className="App-header">
        <p>Welcome to my test app!</p>
        <input
          style={{ marginBottom: "24px" }}
          placeholder="Enter Your Name"
          onChange={handleInputChange}
        ></input>
        <button onClick={writeToConsole}>Submit</button>
      </header>
    </div>
  );
}

export default App;
The key line of code here is console.log(), a built-in JavaScript function that lets us output text or variable values directly to the browser’s console.
In our case above, we do two things. If the user enters a name, that name will be passed to the console.log() function and logged to the console. If the user does not enter a name, it will log an error message with console.error() (this behaves similarly to console.log but logs an error message). Let’s see this happen!

Console logs are a versatile and essential debugging tool that can be used throughout your application. They allow you to track variable values at different stages of execution, monitor the flow of functions and processes, and gain insight into how your code is behaving—all in real time.
Catching Javascript Errors
The console can also be used to catch and show errors in your Javascript code. These errors will be automatically logged and displayed in the console. Let’s try breaking our Javascript code and see what the console tells us.
// app.js
import "./App.css";
import { useState } from "react";

function App() {
  // Add state to track the input value
  const [name, setName] = useState("");

  const writeToConsole = () => {
    if (name === "") {
      console.error("No name provided");
      return;
    }
    console.log("User's name: ", name; // Let's remove the ) from the console.log function. This is invalid Javascript.
  };

  // Handle input changes
  const handleInputChange = (event) => {
    setName(event.target.value);
  };

  return (
    <div className="App">
      <header className="App-header">
        <p>Welcome to my test app!</p>
        <input
          style={{ marginBottom: "24px" }}
          placeholder="Enter Your Name"
          onChange={handleInputChange}
        ></input>
        <button onClick={writeToConsole}>Submit</button>
      </header>
    </div>
  );
}

export default App;
Now, when we try to compile the app, it should throw an error. This is what the console tells us.

The console tells us that there is a syntax error in our App.js file. Specifically, the error comes directly from line 33, and there is an “unexpected token”. If we take a look at that line in our code, that is where we removed the ).
This provides a convenient way to identify and catch errors in your JavaScript code, making the Console an invaluable tool during the development process.
Executing Javascript Code
Not only can we use the console to view information from our applications, but we can also execute code and commands directly in the console.
Here is an example of executing basic Javascript operations. The console gives us an easy way to run this code on the fly.

In addition to running basic operations, you can use the Console to directly interact with your web application. For instance, if you want to update the header text to say “Welcome, {name},” you can do so by executing JavaScript code right in the Console. Let’s see this in action by selecting and modifying elements in the DOM.

The Console offers a powerful and flexible environment for interacting with your website and running JavaScript commands on the fly. Whatever Javascript you would typically write in your editor can be executed here. This is the power of the browser console.
By leveraging features like logging, error tracking, and live code execution, developers can significantly streamline their workflow and troubleshoot issues more efficiently—all without leaving the browser.
What is your favorite feature of the browser console? Did I miss any features? Feel free to share your thoughts in the comments below!

