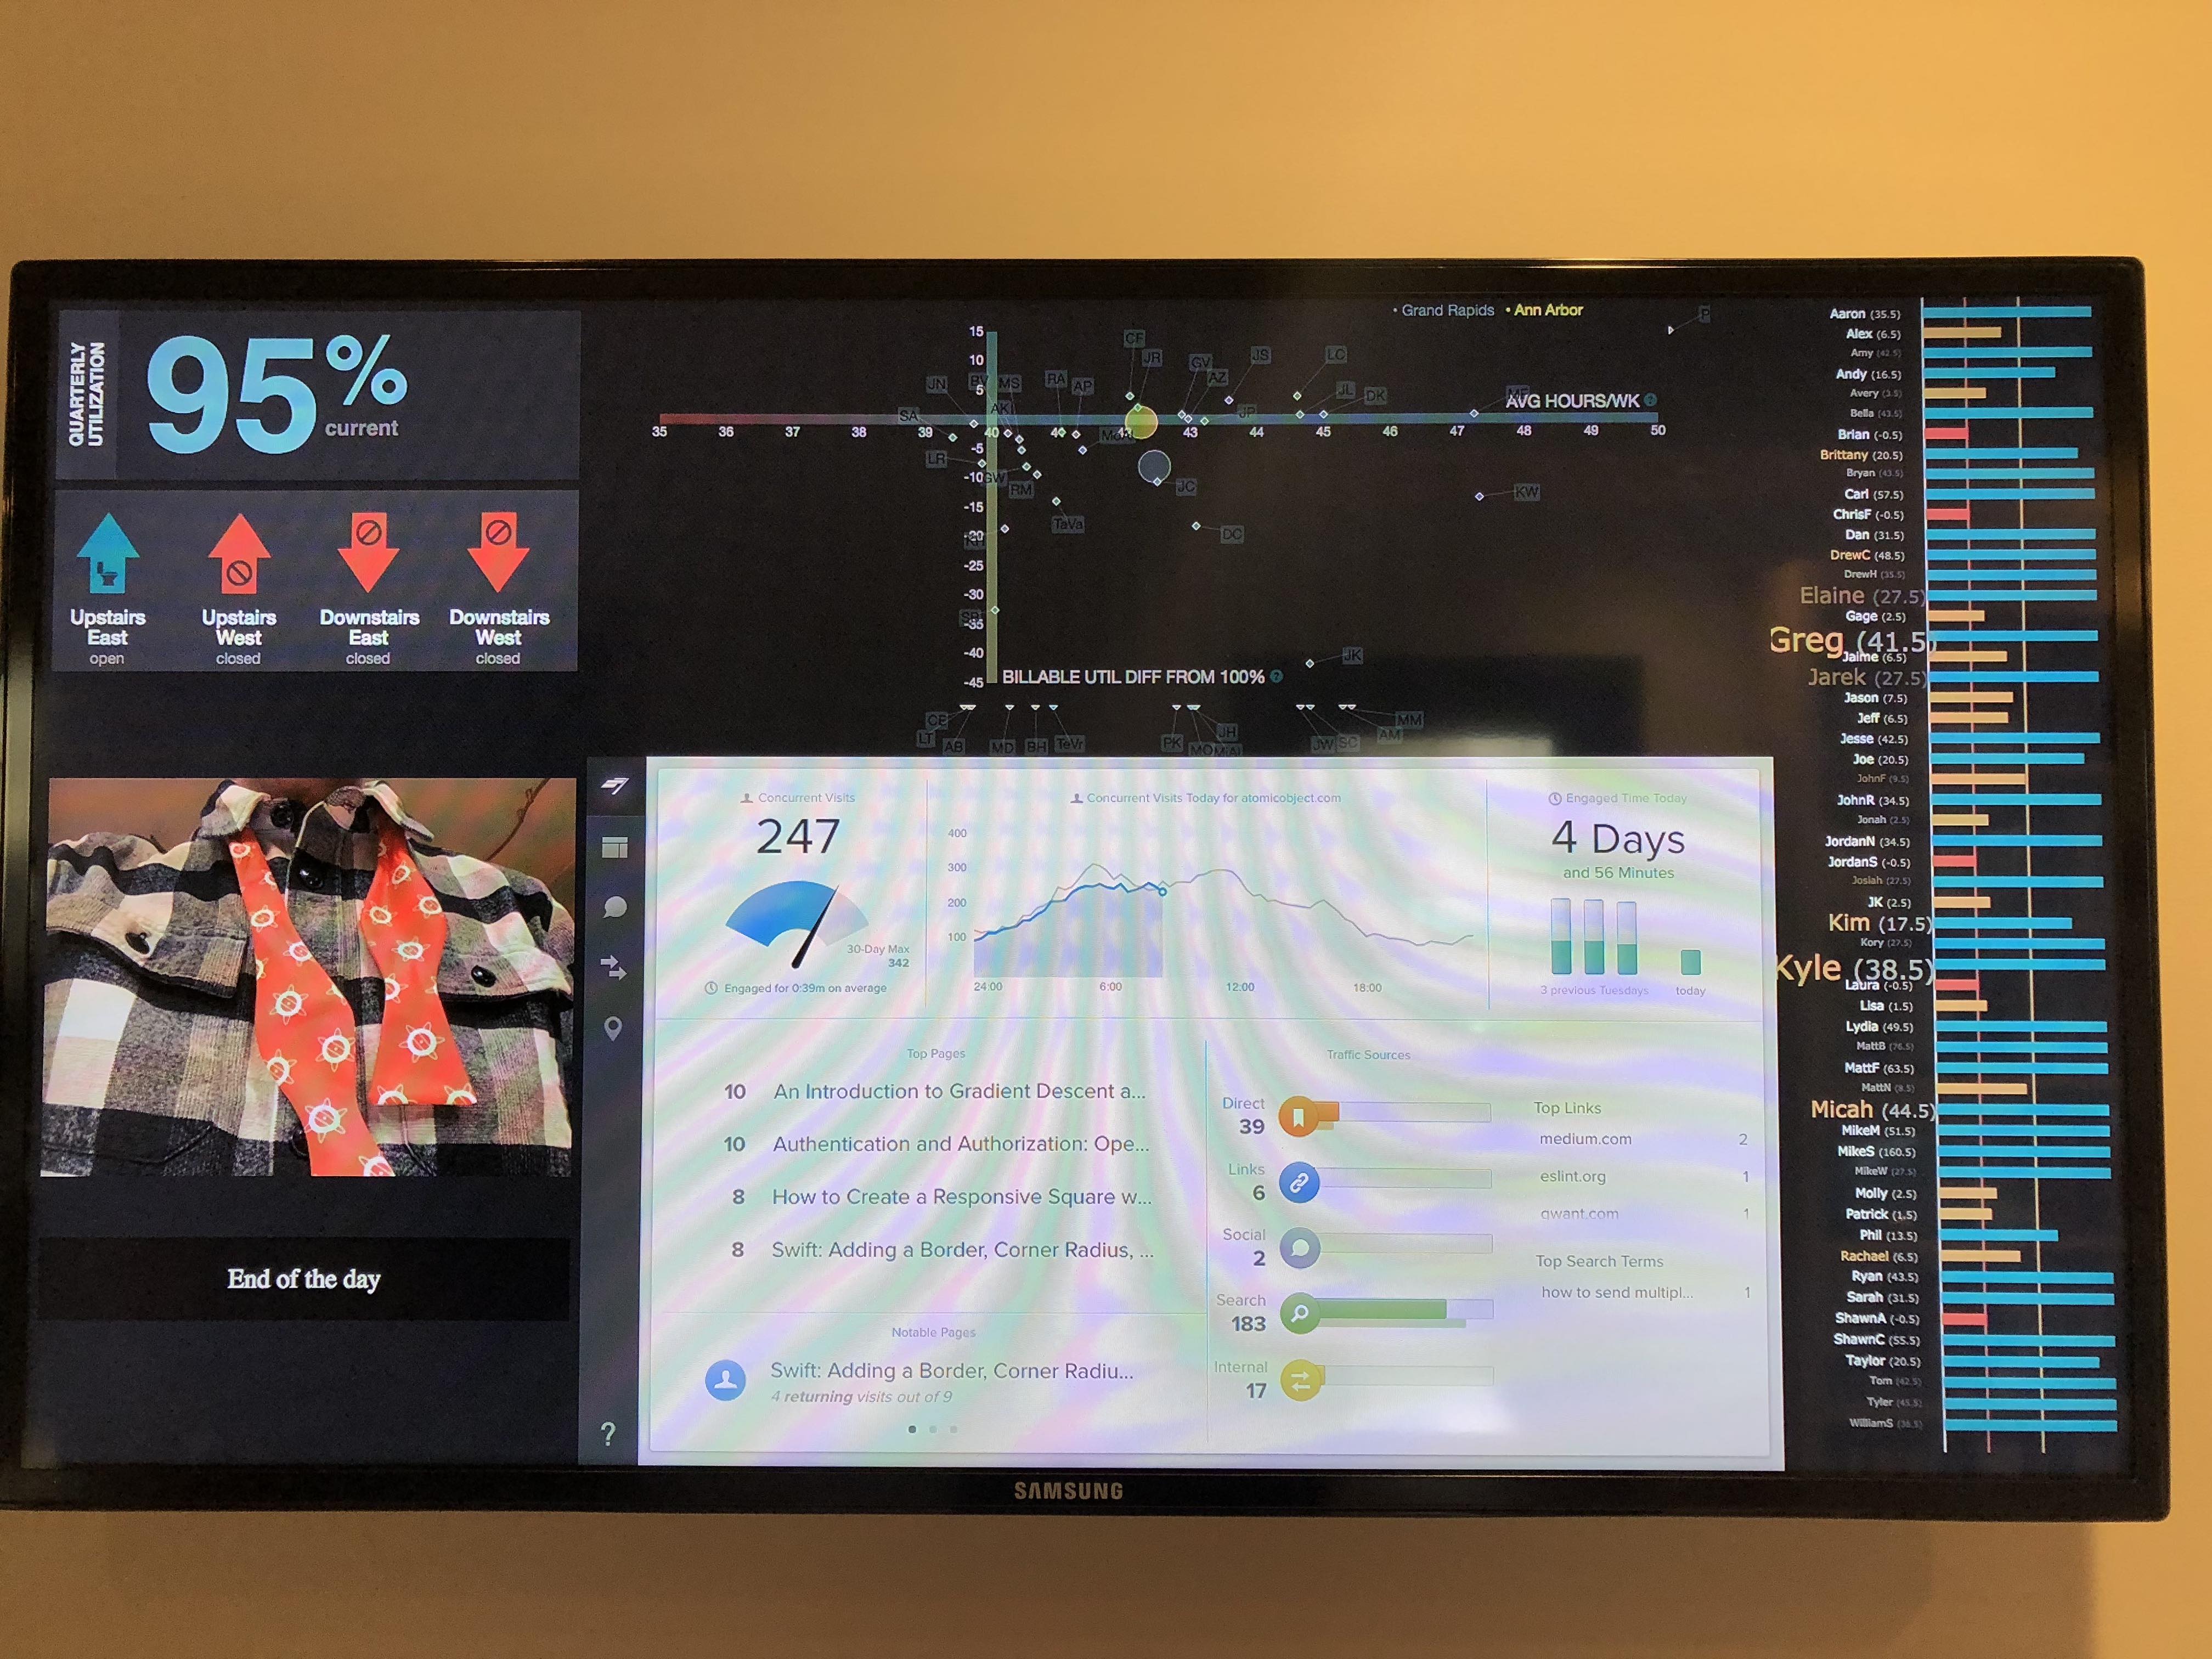
Your secret weapon is data. You have lots of it. It lives in different systems and with different people in your company. But data itself does no good if you can’t turn it into information–information that is aligned to your business strategy and on which you can act to reach your goals.
One way to find success is to start with a scorecard—a list of data points that can tell you, at a glance, how your business is doing. You might have heard this called a dashboard or radiator (as it “radiates” information). But fundamentally, it’s based on displaying Key Performance Indicators (KPIs).

KPIs should represent the current state of things like sales, finances, product/service health, and customer experience. If this seems familiar, it’s because KPIs are like the report cards you received as a student.
The biggest value of KPIs is the way they focus everyone on what is important for your company. That focusing power allows your team to make the right decisions on where to invest limited time, energy, and resources to reach shared goals. Without KPIs, you risk having people working on unimportant tasks with low value, which will eventually lead to low or no profit for your company.
The Wrong Metric to Watch
Most small to mid-size businesses don’t have a scorecard. Instead, they look only at their Profit and Loss (P&L) to know the score. The problem with using P&L is that it reflects something that has happened in the past. You can’t change what’s happened in the past. And when you try to react to a bad quarter, it’s sometimes too late to prevent the next quarter from being bad, too. Put together a string of bad quarters and, before you know it, you can be in a bad business situation.
In a software consultancy where everything is always changing, it’s particularly tricky to find the right KPIs to measure. Which numbers should you watch? How often should they be updated? How will you know if there is a problem? And how do you work the scorecard to find success?
Choosing KPIs for a Software Consultancy
If you are new to the scorecard concept, start simple. Meet with your leadership team and pick four to five KPIs that you want to measure each week. Not all KPIs will be quantitative; some data will be qualitative instead.
Qualitative data includes customer perceptions about service, observations on competitors and the marketplace, or the feelings teams have about their work. Qualitative data is important to provide a complete set of information to guide decisions.
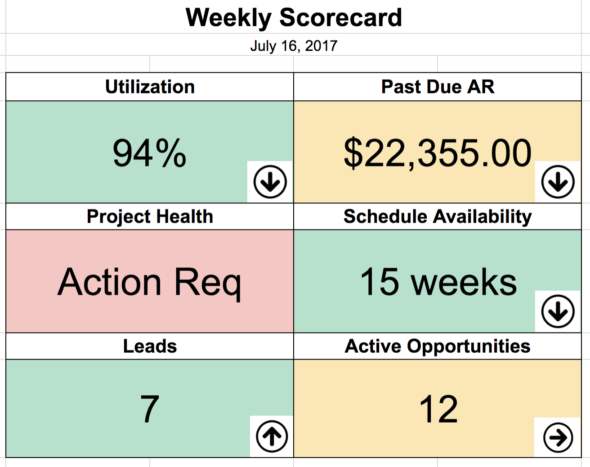
When you pick your KPIs, you will need to identify a threshold that indicates which levels are good, which pose a concern, and which are bad and require action. These thresholds are the key to understanding your performance, and they will be highly personalized to your business situation. You may decide to use green (good), yellow (concern), and red (action required) stoplight coloring to help in the visual display.
After you determine your thresholds, be open to adjusting them as you begin to use your scorecard. If every metric is always in the “concern” or “action required” state, the scorecard may not be too useful. Tune the thresholds to move your team toward the goals you have set for your company.
For example, good metrics for a software consultancy would be utilization, schedule availability, sales, project health, and accounts receivables (AR). Each of these focuses on an important part of the consulting business, from mapping sales to billable work to collecting the cash that drives the business forward.
Utilization
Measuring utilization is a critical KPI for any organization that bills by the hour. A high utilization number correlates to a profitable organization. A low utilization number, on the other hand, is a big concern. This is especially true when the hours billed won’t cover the costs of running the business. A good threshold for utilization is above 90% (36 hours/week). If utilization falls below 85% (34 hours/week), dig into what is happening and make the required changes.
Schedule availability
In David Maister’s book, Managing the Professional Service Firm, he states that scheduling is the most important function in a consultancy. Its also the hardest.
Knowing how far out a billable person is available for work keeps the sales team focused on filling gaps in the existing schedule. This helps keep utilization high since there is always billable work.
Look at the weekly work schedule and determine how many weeks exist until the next team member is available for new work. A good threshold could look more like a “concern” when you have eight weeks, and “action required” when only six weeks remain before more billable work is needed.
Sales
This is one of the most common KPIs for business. In a consulting organization, it is closely related to schedule availability. Knowing the health of your sales funnel can help you take appropriate action to close scheduling holes as they appear. A typical sales funnel consists of leads, opportunities, contracts, and win/loss categories. You can pick one of these to start with or measure all of them at once.
For a consultancy, remember to handle new sales and contract extensions in the same manner. Both represent billable work that will keep your team busy and fill scheduling gaps.
- Leads – How many new leads have come through in a week?
- Opportunities – These are leads that are real. Count how many real opportunities you have active in a given week, or measure the change in opportunities: new opportunities vs. closed.
- Contracts – Here, you are measuring how many software contracts your team has sent in a given week.
- Win/loss – The typical number to measure is how many contracts you’ve won. You can also measure the ratio of won-to-lost contracts.
- Close ratio – Another common sales metric to look at is your close ratio. This number compares won contracts against the total opportunities you have active.
With all of these sales metrics, you will need to gauge the desired state at each stage in your sales funnel. By knowing your close ratio, you can work backwards from your desired scheduling model to know how many leads you should be bringing in to close holes in your schedule.
For example, if your typical contract to keep a team busy takes eight weeks to close, and your close ratio is 33%, then you need to be working at least three solid opportunities early in your sales funnel. You probably need twice as many leads another couple weeks ahead of that.
Project health
Project health is likely to be a qualitative look at the state of active project commitments to customers. Are they on budget? Are there roadblocks? Unhappy clients? Unhappy team members?
The best approach for this metric is to seek weekly input from those responsible for managing projects. Good? Concern? Need action? Try to capture a snapshot of the state of the office each week. Stay consistent on the way you measure this from week to week so you can identify trends.
Accounts receivable (AR)
With AR, you are trying to stay ahead of collection issues that may impact cash flow. This metric looks at the amount of AR that you are waiting to collect and when you will receive it. You will want to be sensitive to large amounts of AR outstanding or AR that is aging beyond agreed-upon contracts.
A good approach to this KPI in your scorecard would be to show the number representing all outstanding AR beyond 30 days. Indicate if there is a concern or action required by whether your AR is very large beyond 30 days, or small, but beyond 60 days. This is another metric you will have to tune based on your typical contract terms.
Getting the Process Right
Having a scorecard is no guarantee for success. You need consistent habits that force your leadership team to focus on the numbers, make decisions, and take the necessary actions. Without that crucial step, your scorecard has no value, and soon it will stop being updated as that process involves more work.
A good approach to using a scorecard is to measure and review weekly with your leadership team. Use your thresholds as goal posts for your key business processes. Make the review quick. When you identify a needed action, use a process to follow through and make changes. Assign the action to a leader and commit to an update by the following week’s meeting. Follow this discipline to close the loop and address issues.
As you get used to measuring KPIs weekly, the next step is keeping a history of the scores. Over time, you will be able to see trends in how the data is changing. This can be helpful in learning whether the actions you are taking are having a positive or negative effect. If the same issues keep appearing, you know there is a larger systematic issue to address, and correcting it will require more dedicated thought and time.
Using a Scorecard
Bob Parsons, Founder of GoDaddy, says “Anything that is measured and watched is improved”. The idea of scorecards has been around a long time. They are often used in connection with a business operating framework such as in Gino Wickman’s book Traction or Verne Harnish’s book Scaling Up.
Used properly, scorecards become valuable in driving your business towards success. Start small with numbers you can measure, and make a habit of meeting weekly to review the scorecard. Sleep easier knowing that you’re staying on top of problems and acting before they cause failure.
Tomorrow I’ll review Atomic’s Radiator, a custom scorecard that helps everyone in our office stay aware of key metrics.


