Article summary
Your development tools are important: good tools allow you to write and debug code effectively and quickly. For web development, I am constantly finding new things to love about the Chrome DevTools, which is available in every Google Chrome browser. It supports inline HTML and CSS editing, JavaScript breakpoints, viewing network calls, and many other things.
Here are some of my favorite lesser-know features of DevTools.
Awesome CSS Editing
1. Add Custom CSS Rules
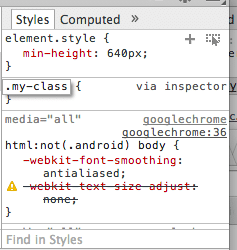
The + sign in the upper right will allow you to add a style for any selector.
2. View Your Margin, Border, and Padding
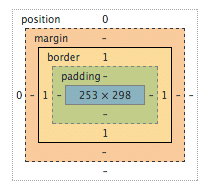
The picture at the bottom lets you know how big a selected DOM element is as well as how many pixels its padding, border, and margin each occupy.
3. Emulate Mobile Devices
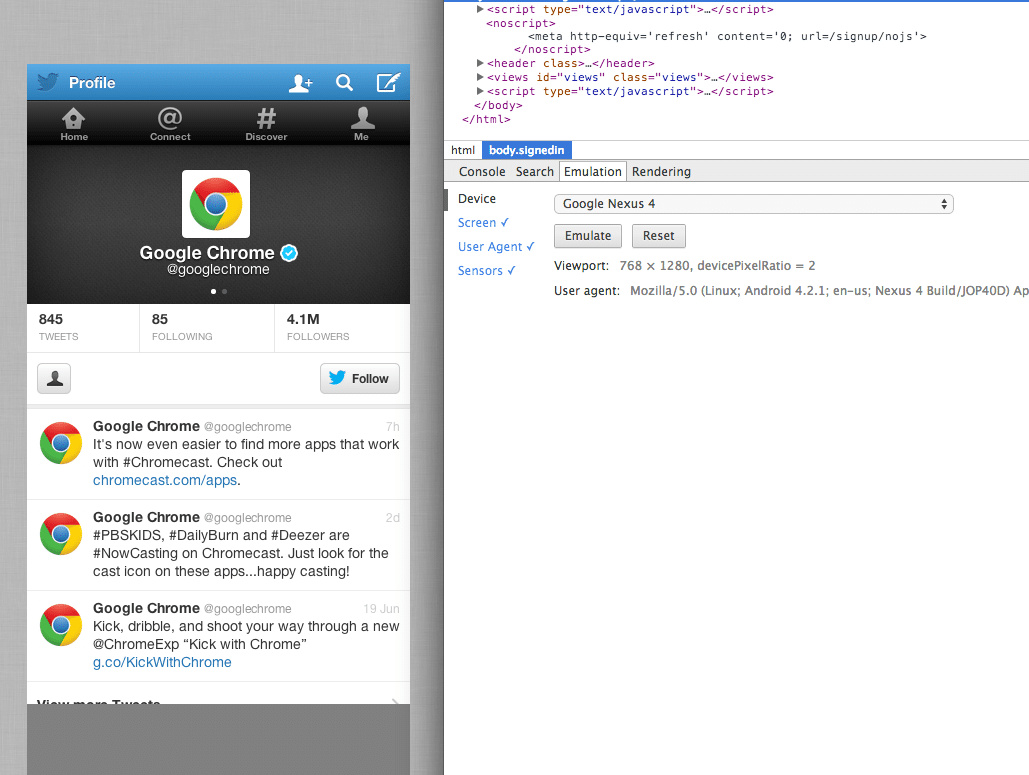
You can view your page in compatibility mode for several different mobile devices. Enable this feature in the bottom console pane on the “Emulation” tab
Seeing Your JavaScript In Action
The “Sources” tab in the dev tools allows you to take a look at your JavaScript files in browser. You can verify that the correct version of the file has been loaded, and set and manage your breakpoints to debug your code. Combined with the console, you can evaluate any JavaScript at anytime and at any point in your code. It also supports source maps, which means you can edit CoffeeScript as well.
4. Disable Your Browser’s Caching
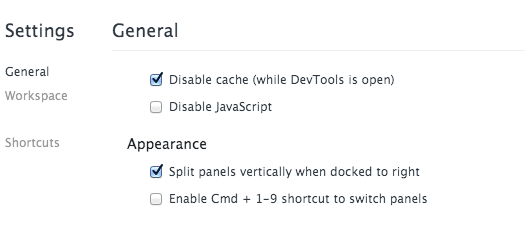
You can disable your browser’s caching when dev tools is open. This is handy for making sure your browser is using the lastest and greatest version of your files every time. To do this, click on the gear in the upper right corner and check “disable cache when DevTools is open.
5. Use DevTools as Your Editor
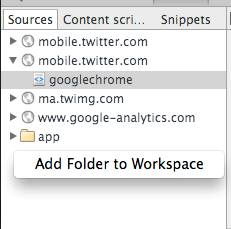
You can take it a step further and write your JavaScript from inside the developer tools. To do this, right click on the left hand pane and select “Add Folder to Workspace”. VOILA your JavaScript files are accessible from DevTools, and you can fix them as you debug them in your browser.
Those are the less obvious features of DevTools that I find myself using over and over. What are your favorite features?