Article summary
There may be instances where the Jetty web server and the applications it hosts run out of memory, but the underlying cause of the failure is not immediately obvious. In such instances there are tools available and services on Jetty that enable more in-depth and detail analysis.
Common Failures
Here are the most common memory-related failures that occur in a Jetty web service:
- Exceeding the maximum number of native threads the system has allocated to the jetty user (seen as “java.lang.OutOfMemoryError : unable to create new native Thread”)
- Exceeding the capacity of the heap as allocated and configured by Jetty (set to 2048kb) (seen as “java.lang.OutOfMemoryError : Java Heap Space”)
- Exceeding the capacity of the permgen (where classes are allocated, transformed into MetaSpace in JDK 1.8 ) space (set to 1024kb)
Common Causes
Exceeding Maximum Thread Allocation
- Unbounded thread creation
- Commonly caused by leveraging Java’s “ExecutorService” and creating unbounded thread pools via “cached thread pools”, which don’t clean up threads at a rate that’s acceptable during peak load.
- Jetty’s QueuedThreadPool (serves incoming requests) maximum thread size is too high (> 200) (under /etc/jetty.xml).
- The system’s maximum thread allocation for the user is too small (see /etc/security/limit.conf or /etc/security/limits.d/*).
Exceeding Maximum Heap Size
The most common cause for this failure is that the Jetty is under peak load where the garbage collector is unable to respond in an appropriate amount of time to free memory. In all likely hood, the heap space should be increased to deal with the increase in traffic.
If the heap space size is only ever increasing and does not decrease, there is likely a memory leak where the JVM never has the opportunity to garbage collect objects.
Exceeding the Capacity of PermGen Space
- The underlying applications installed on Jetty generate classes dynamically and PermGen space should be increased.
- A library or a piece of application code is dynamically creating an unbounded number of classes that are not eligible for garbage collection.
- For example, MessagePack generates template classes for each instance of MessagePack where those instances cache templates per instance. If the application creates too many instances of MessagePack, it’s likely that too many classes will be generated, which will eventually lead to a memory failure.
Diagnosing Issues
The most effective way to diagnose issues related to memory on the Jetty web service is to connect to it via JMX and monitor it using jconsole:
By default JMX is not enabled on Jetty. Which means that to enable it you will have to uncomment the following lines in the start.ini file (located under /opt/jetty/).
--module=jmx
jetty.jmxrmihost=localhost
jetty.jmxrmiport=1099
-Dcom.sun.management.jmxremote
-Dcom.sun.management.jmxremote.ssl=false
-Dcom.sun.management.jmxremote.authenticate=false
Jetty will need to be restarted in order to enable JMX services: service jetty restart
Since the most servers run in a headless (no GUI) environment, you will need to connect to it remotely. The server may block port 1099, where the only way to connect is to leverage SSH port forwarding:
ssh -D 1099 root@virtual-machine-server
Once port forwarding has been established, jconsole can be launched as follows:
jconsole -J-DsocksProxyHost=localhost -J-DsocksProxyPort=1099 localhost:1099
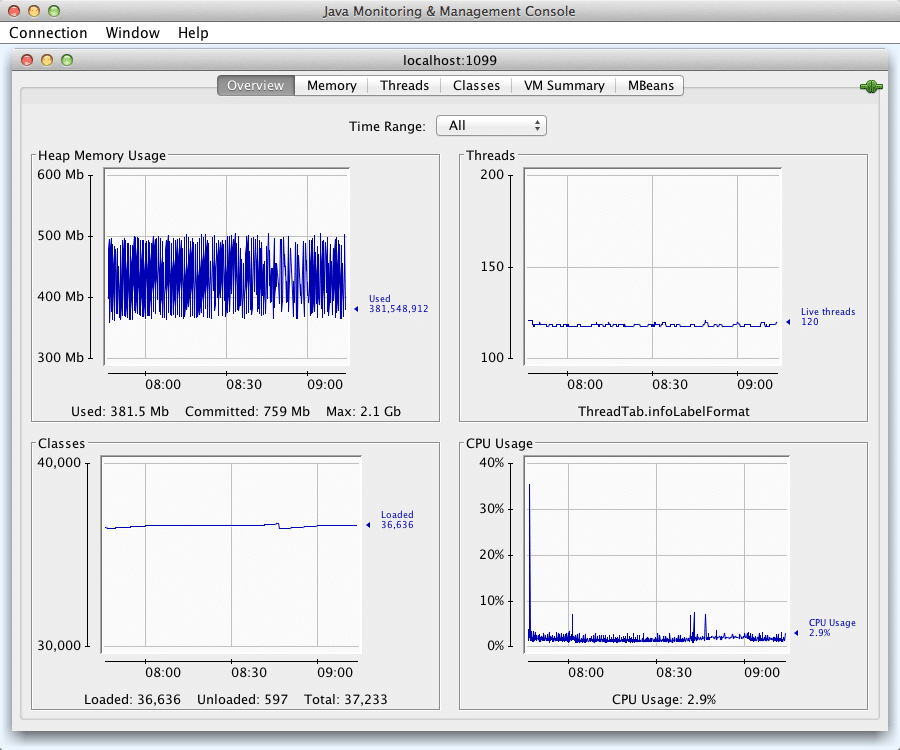
At this point jconsole should present a dashboard similar to this:
Identifying Issues
When monitoring the JVM via jconsole, issues can be identified fairly easily using the graphs. More detailed analysis will need to be done by evaluating the heap via VisualVM.
Below are signs of trouble that may merit investigation:
- An ever-increasing number of classes being loaded by the JVM (bottom left graph).
- Large spikes in the thread count that do not eventually go down or plateau (top right graph).
- The heap space should always fluctuate up-and-down (top left graph). If it does not that is a sign of the garbage collector is able to run or a fairly large memory leak exists.
- CPU utilization staying too high for a long period of time (bottom right).
- The garbage collector may be thrashing which is causing the CPU to spike.
- The server may just need more CPU cores to handle peak traffic loads.
Heap Dump
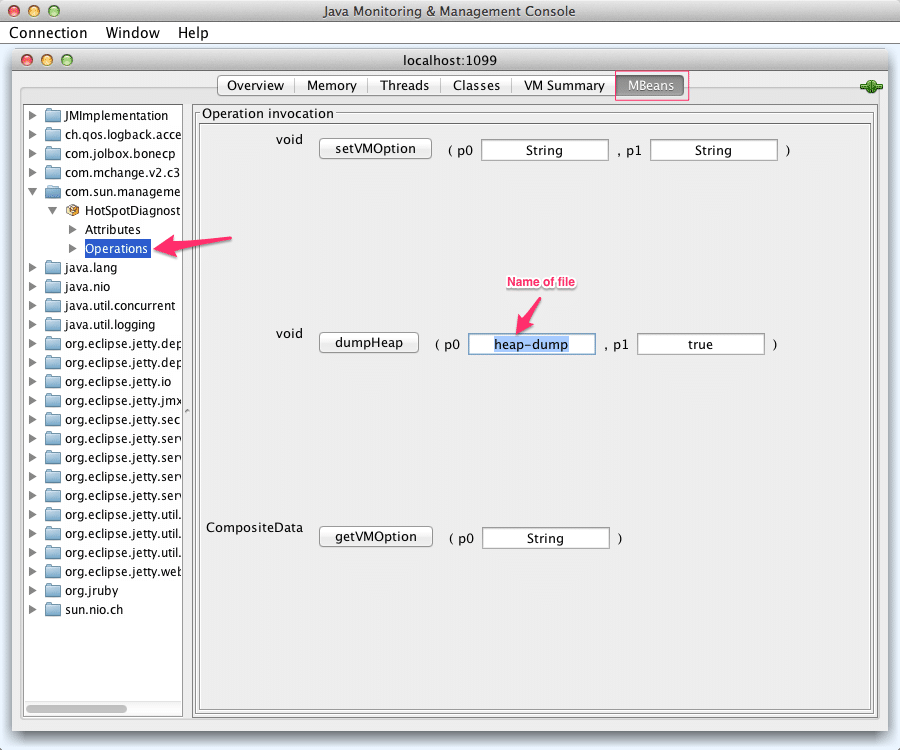
A snapshot or dump of the heap can be taken using jconsole:
The heap dump file will be written to the root of the Java application (/opt/jetty/, for example). The heap dump file can then be copied using scp or sftp to a local machine that is running VisualVM for analysis.
- Click the “Load Snapshot” icon in the upper left.
- Change the “File Format” in the dialog to “Heap Dump”.
- Choose the saved heap dump file.
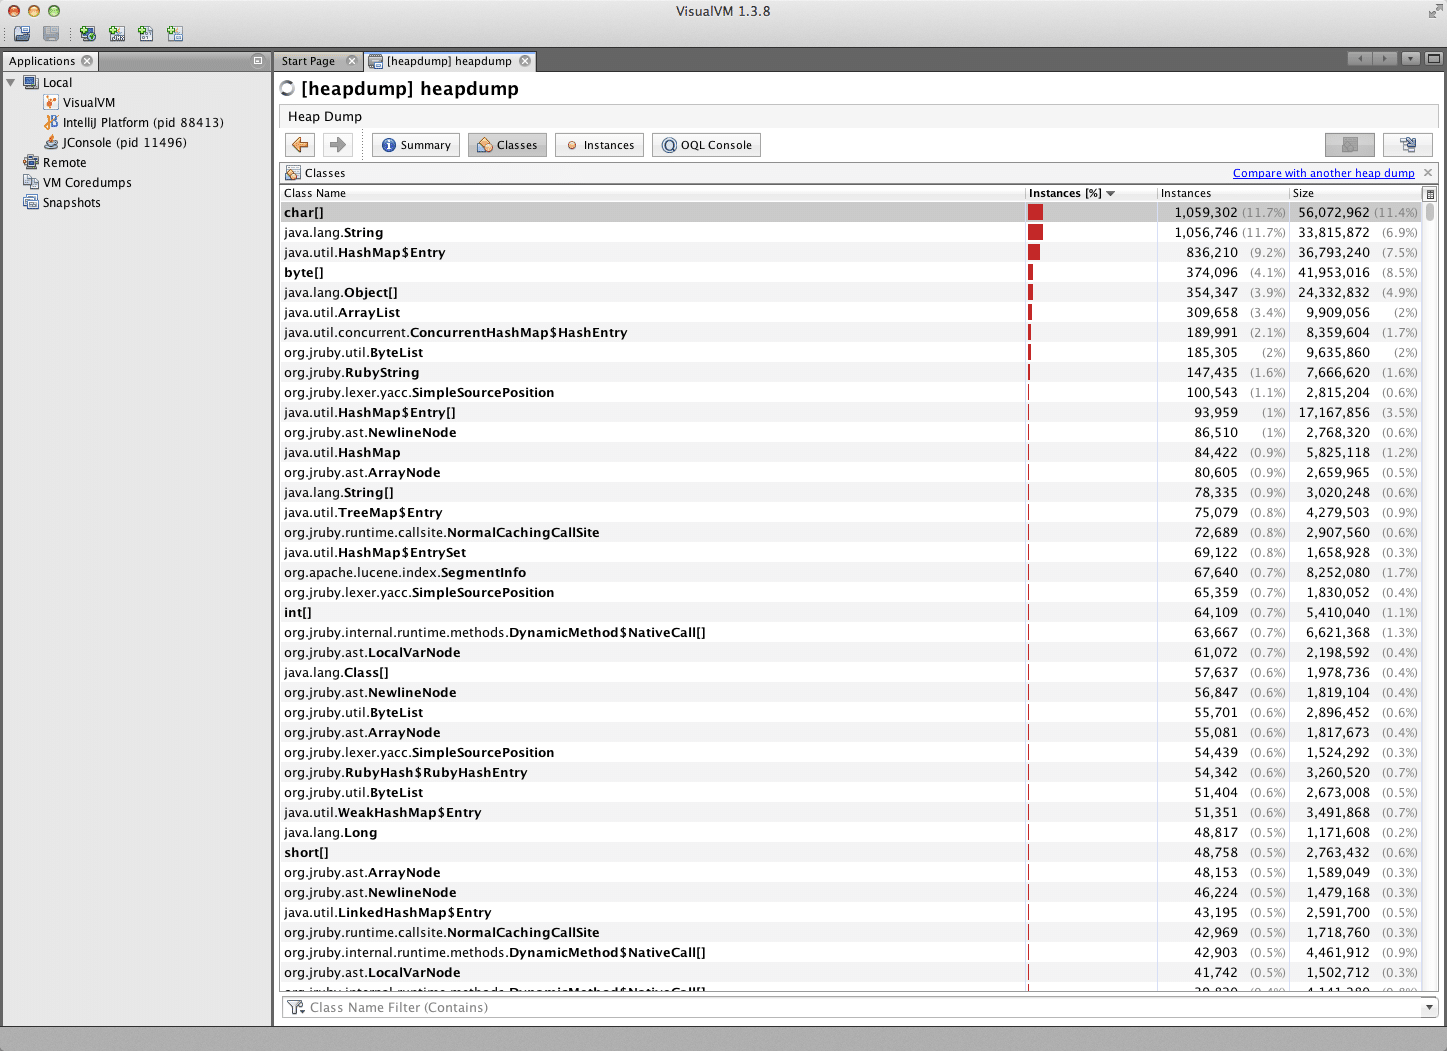
It can take 15-30 seconds to import the file, and then a dashboard similar to this should be shown:
Class loading and memory usage issues can be identified by:
- Look for instances of application objects (tracking char[] or String’s is probably not necessary) that there are a number of instances that should be short-lived generally
- If the number of classes loaded is continually growing, looking for repetitive entries of a class name.
- For instance, SomeClass_$Template102232 is likely to be a dynamically generated subclass created by application code or third-party libraries.
Conclusion
Despite all of the progress made in automatic memory management in the JVM, there are still pitfalls that can cause a lot of pain, and this is especially true for web applications that have to run 24/7. It is important that ongoing memory analysis, monitoring, and peak load testing are done to ensure that your web application continues to hum.


