Browser DevTools, or Developer Tools, provide web developers with powerful development capabilities. They enable quick editing, testing, and debugging of software in real-time. Best of all, nearly every modern browser includes DevTools right out of the box!
In the first two part of this series, we explored the Inspector—a tool for examining and editing HTML and CSS in real time—and the Console, which provides a flexible environment for running JavaScript commands and troubleshooting issues directly in the browser. In this third part, we’ll turn our attention to another crucial feature of DevTools: the Debugger.
Accessing the Inspector
There are two easy methods to open your browser DevTools to access the inspector:
1. Right-click on any element on the web page and click on inspect. This should pop open your browser DevTools.
2. You can use the following keyboard shortcuts:
- Windows/Linux: Press
Ctrl + Shift + IorF12 - Mac: Press
Cmd + Option + I
If you have done all of this correctly, you should see something that looks like this:

Introducing the Sources Tab
In this third part of the DevTools series, we’ll focus on the Sources tab—an tool that allows developers to debug your code directly within the browser. This allows you to pause and step through your website’s JavaScript as it runs, set breakpoints, and examine variables in real time.
Viewing your Project’s Source File
The first thing we can do in the Sources tab is to view the folder and file structure of our web page. This can be done through the left hand preview pane. This behaves similar to the directory view of any ordinary IDE.
You can expand folders, locate your JavaScript files, and open them to view the code that runs on your page. You’ll also see CSS and other resources associated with your site.

To begin debugging, find and open the file containing the code you want to inspect. This sets you up to debug directly from your browser.
Setting a break point
Now that we have found the file that we want to debug. Let’s learn how to set a breakpoint and directly debug our code.
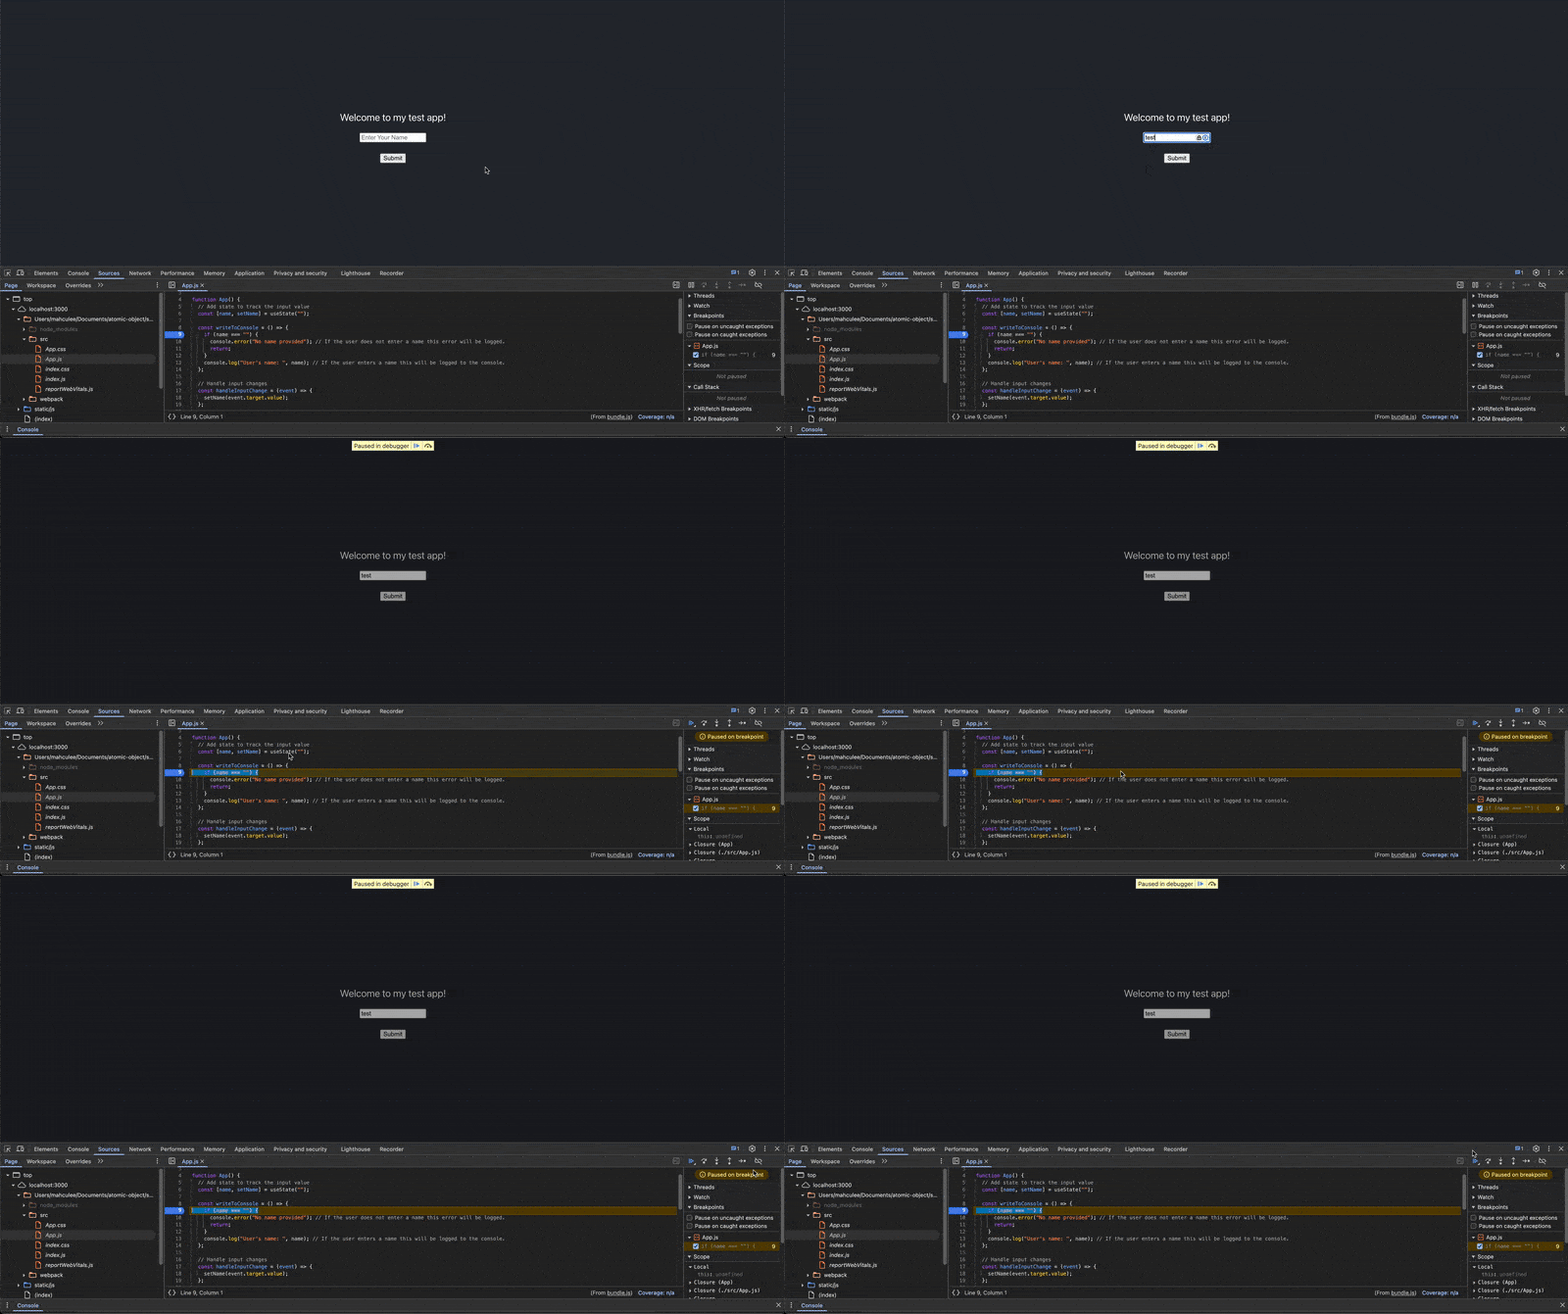
To set a breakpoint we can click the area right next to the line number of the line you want to set the breakpoint on. In our example, let’s put a breakpoint on line 9 of our writeToConsole() function.

This means that whenever our webpage executes this code, it will start our built-in debugger. In our case, this is triggered when submit some text in our text field. Let’s see what happens.

Debugging your code
We see that when I tried to trigger a submit, the browser automatically freezes the webpage on the line of code we put our breakpoint. We can now see the debugger view. On the right hand side we can see the debugging tools to allow us to step through the code.
Similar to an IDE we can see the different tools in the top right bar. Here is how each one breaks down from left to right.
- ▶️ (Resume) -Resumes the execution of our webpage.
- ⏭️ Step Over – Executes the current line of code and moves to the next one.
- ⬇️ Step Into – Executes the current lie of code and then enters any function called on that line.
- ⬆️ Step Out – Steps out of a function that you’ve stepped into.
Step Over
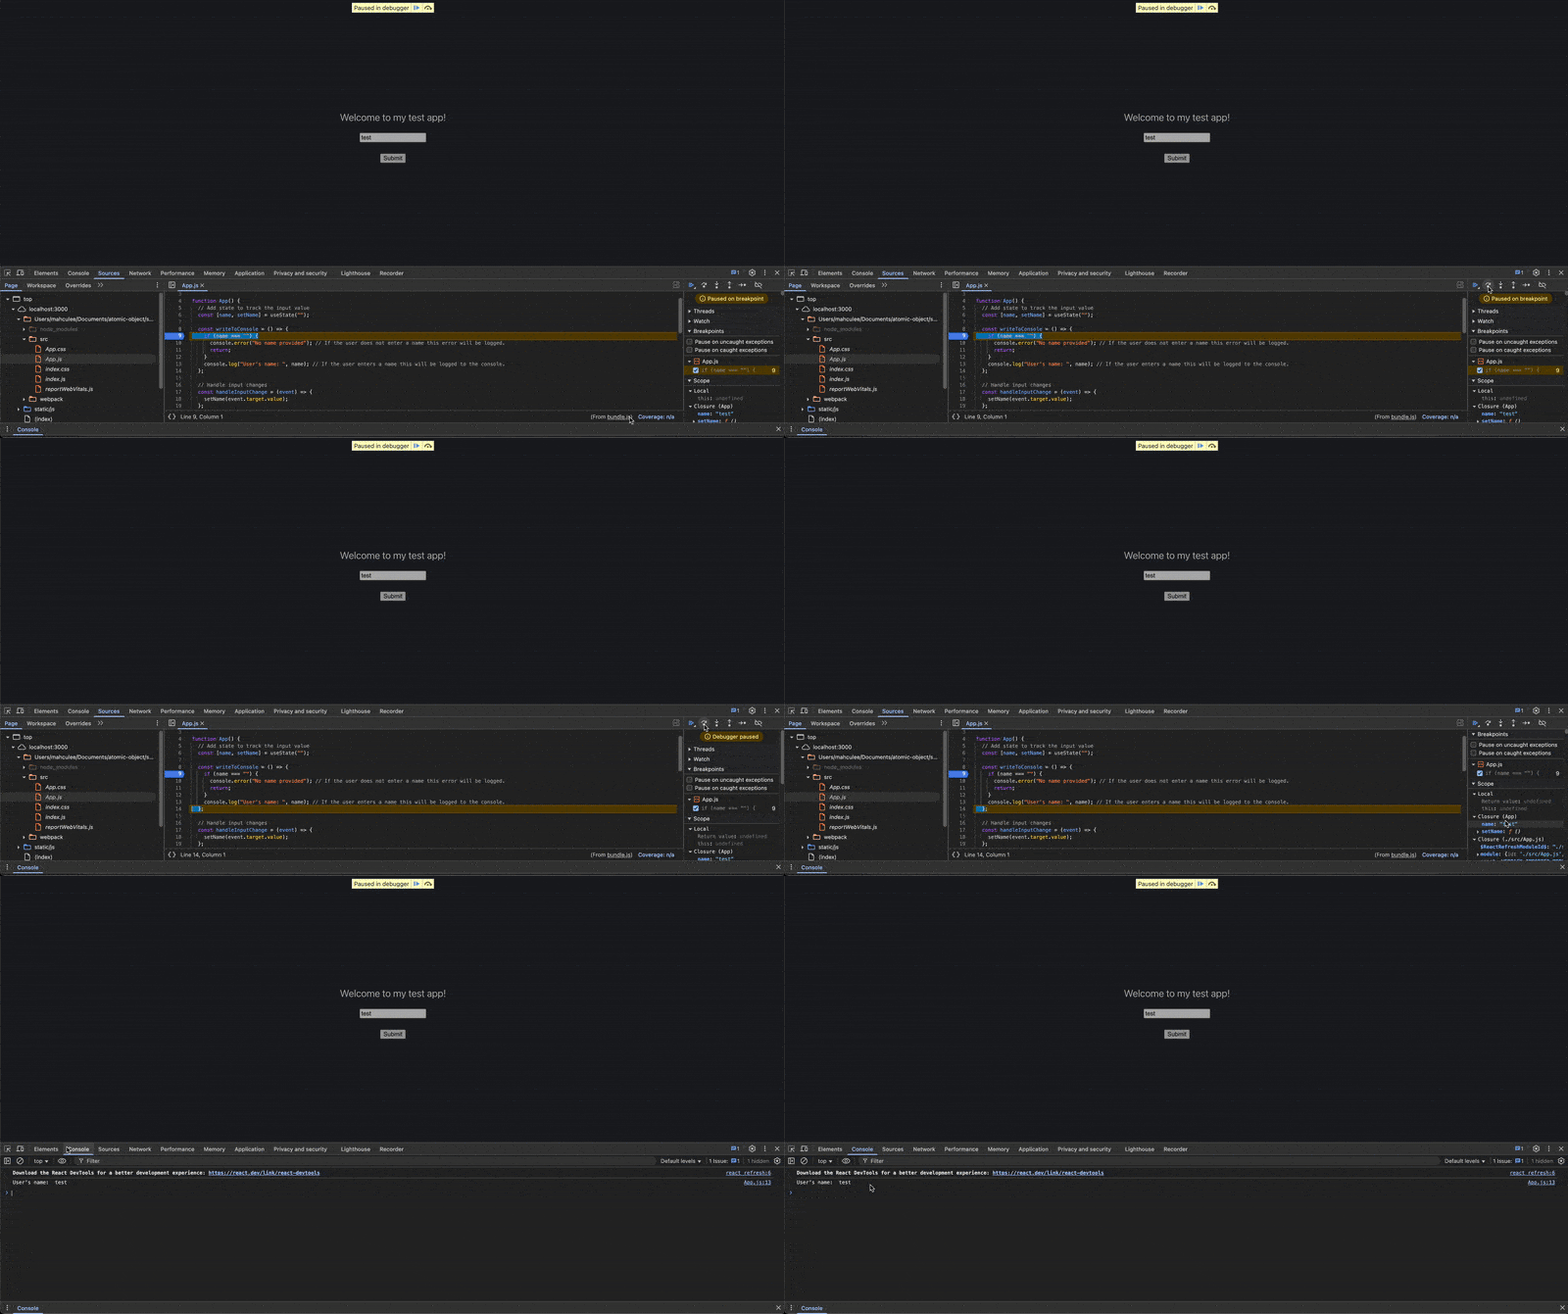
In our case we will be using the Step Over functionality to run each line in our code. Let’s run through an example!

We start by stepping over our code. On the first line, we check whether the input text is an empty string. Since we passed in the string “test”, the condition in the if statement is not satisfied. As a result, when we step over the line, the debugger skips the if block entirely.
Next, we land on the console.log statement. If we step over one more time, we see that the line is executed and its output appears in the console. On the right-hand pane, we can also inspect the current variables in scope and their assigned values.
Step in and out
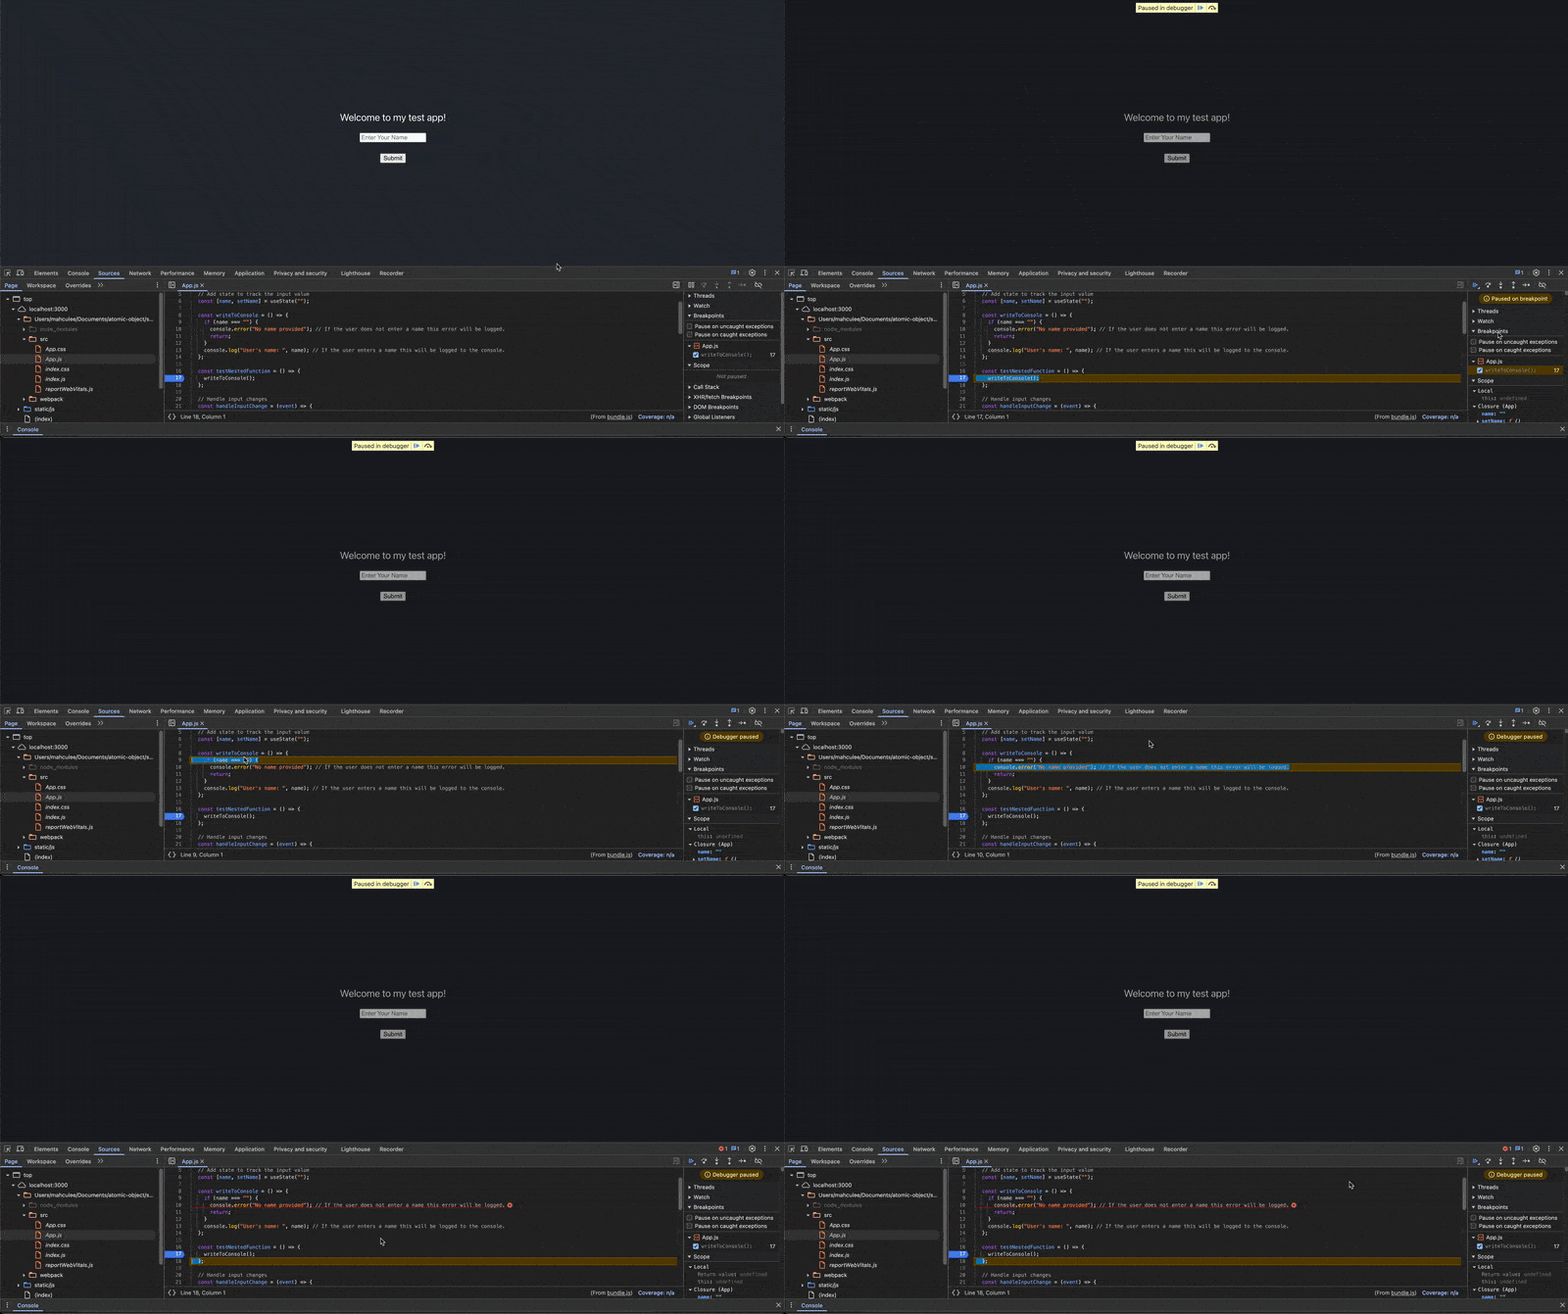
Let’s now run through an example of using the Step Into and Step Out functionality. Let’s update our code to use a different function to call our writeToConsole() and put a breakpoint there.

In this example, when we run the debugger, it pauses at the call to writeToConsole(). When we Step Into the function call, the debugger enters into the writeToConsole() function itself. We can now continue stepping over the code as usual.
Since we’ve stepped inside a function, we also have the option to Step Out. Doing so exits the writeToConsole() function and returns us to the surrounding block in testNestedFunction().
These are just a few examples of how to effectively use the debugger to step through your code. It provides a powerful way to debug directly in the browser, which can easily be integrated into your development workflow to test on the fly and increase overall efficiency.
