
Browser DevTools, or Developer Tools, provide web developers with powerful development capabilities. They enable quick editing, testing, and debugging of software in real-time. Best of all, nearly every modern browser includes DevTools right out of the box!
In the first three parts of this series, we explored three essential browser dev tools: the Inspector, for examining and editing HTML and CSS in real time; the Console, for running JavaScript and troubleshooting issues directly in the browser; and the Debugger, for stepping through code without leaving the page. In this fourth part, we’ll take a look at the Network Monitor.
Accessing the Inspector
There are two easy methods to open your browser DevTools to access the inspector:
Right-click on any element on the web page and click on inspect. This should pop open your browser DevTools. Or, you can use the following keyboard shortcuts:
- Windows/Linux: Press
Ctrl + Shift + IorF12 - Mac: Press
Cmd + Option + I
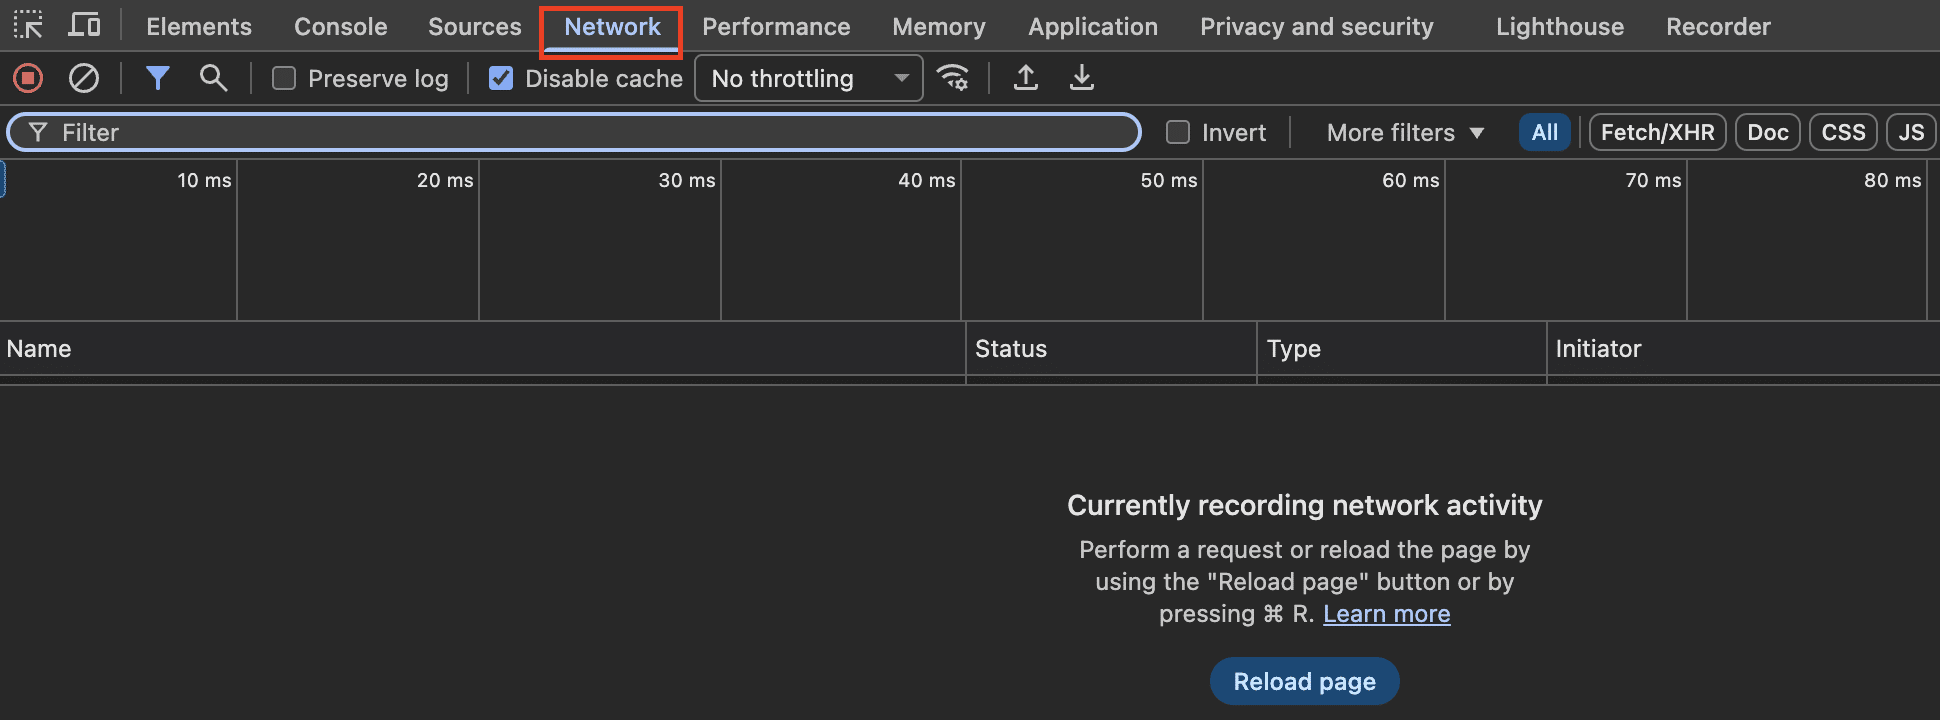
If you have done all of this correctly, you should see something that looks like this:
Introducing the Network Tab
In this fourth part of the DevTools series, we’ll focus on the Network tab—a tool that allows developers to see and inspect the requests your browser makes as a page loads. This makes it easy to debug API calls, examine response data, and understand how long different resources take to download.
You can think of it like this: the Network tab shows every conversation between your browser and a server.
Network Tab Overview
Let’s spin up our test app from the previous parts of this series and look at the different components of the Network tab.
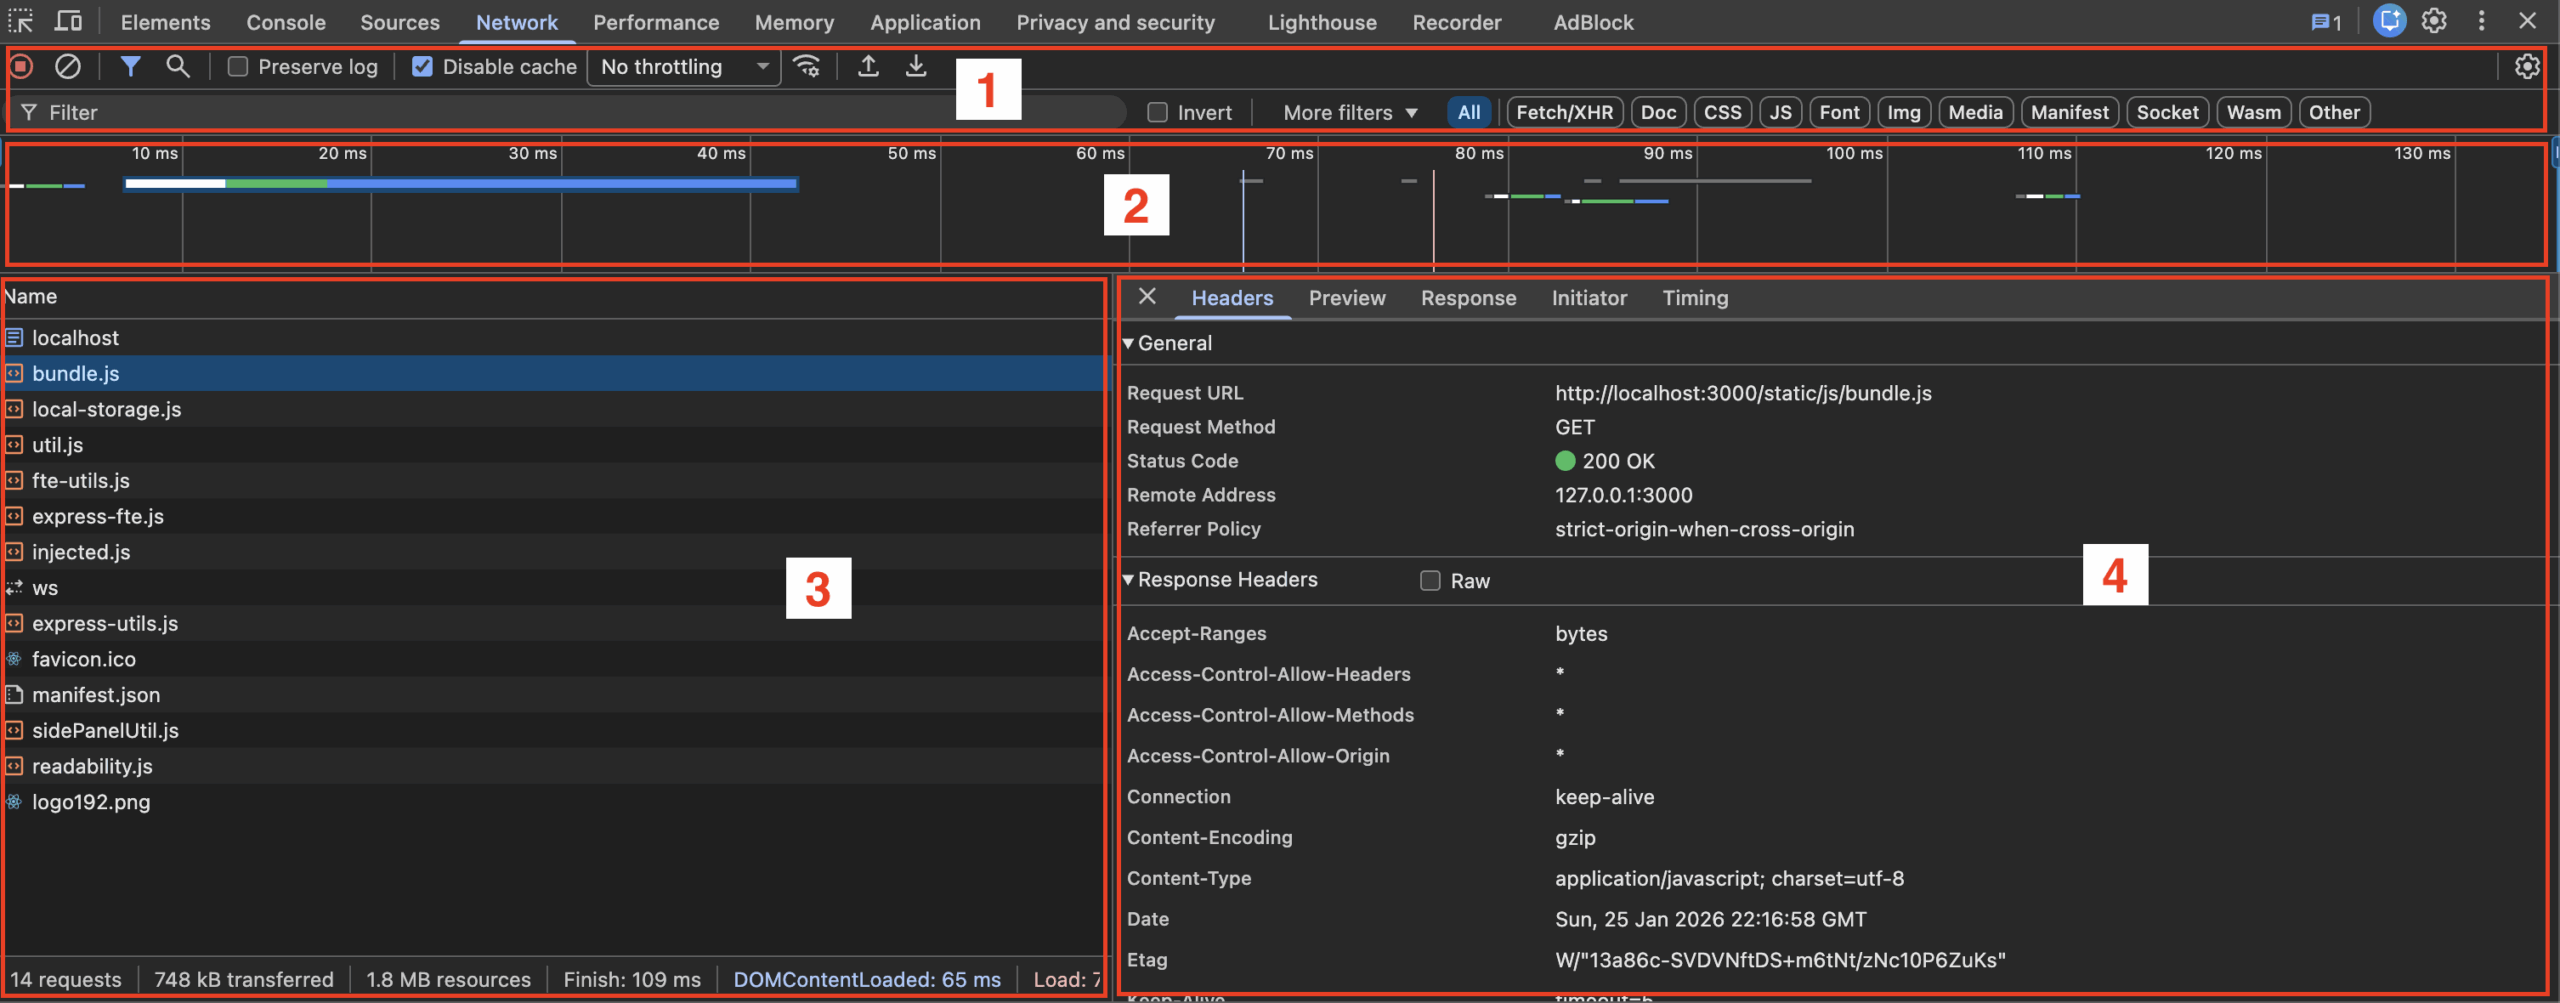
- This top bar is like a mini toolbar for the Network tab. From here, you can start, pause, or clear recorded requests, preserve logs across page reloads, disable the cache, throttle your network speed, and filter requests by different criteria—plus a bunch more handy options for debugging.
- This section acts as a performance monitor for your page’s network requests. Here you can see each request and how long each one took to complete. This helps you debug the order in which requests run and spot slow requests that drag down page performance.
- This section is the meat and potatoes. It contains a list of all the network requests the page makes, in the order they were made. This is where you’ll see every resource the browser loads—HTML, JavaScript, images, and background connections—so you can understand exactly what was requested and when.
- Finally, this is the network request details pane. Here you can drill into an individual request and see detailed information about it—like the URL it hit, the HTTP method used (GET, POST, etc.), the response status code, and the content returned in the response.
This is by no means an exhaustive list of everything the Network tab can do, and we won’t have time to cover every feature in detail. Instead, we’ll walk through an example that highlights the most important ones.
Monitoring a Network Request
For this example, I’ve hooked up a simple network request that hits an endpoint and returns some random data. Here’s what the Network tab looks like after the request is made.
In the lower-left panel, you’ll notice a long list of network requests. Many of these are made automatically by the browser to load the page itself—things like the HTML document, JavaScript files, images, and other supporting resources. We won’t dive into all of them here, but feel free to choose any random webpage and click around on your own.
Success Response
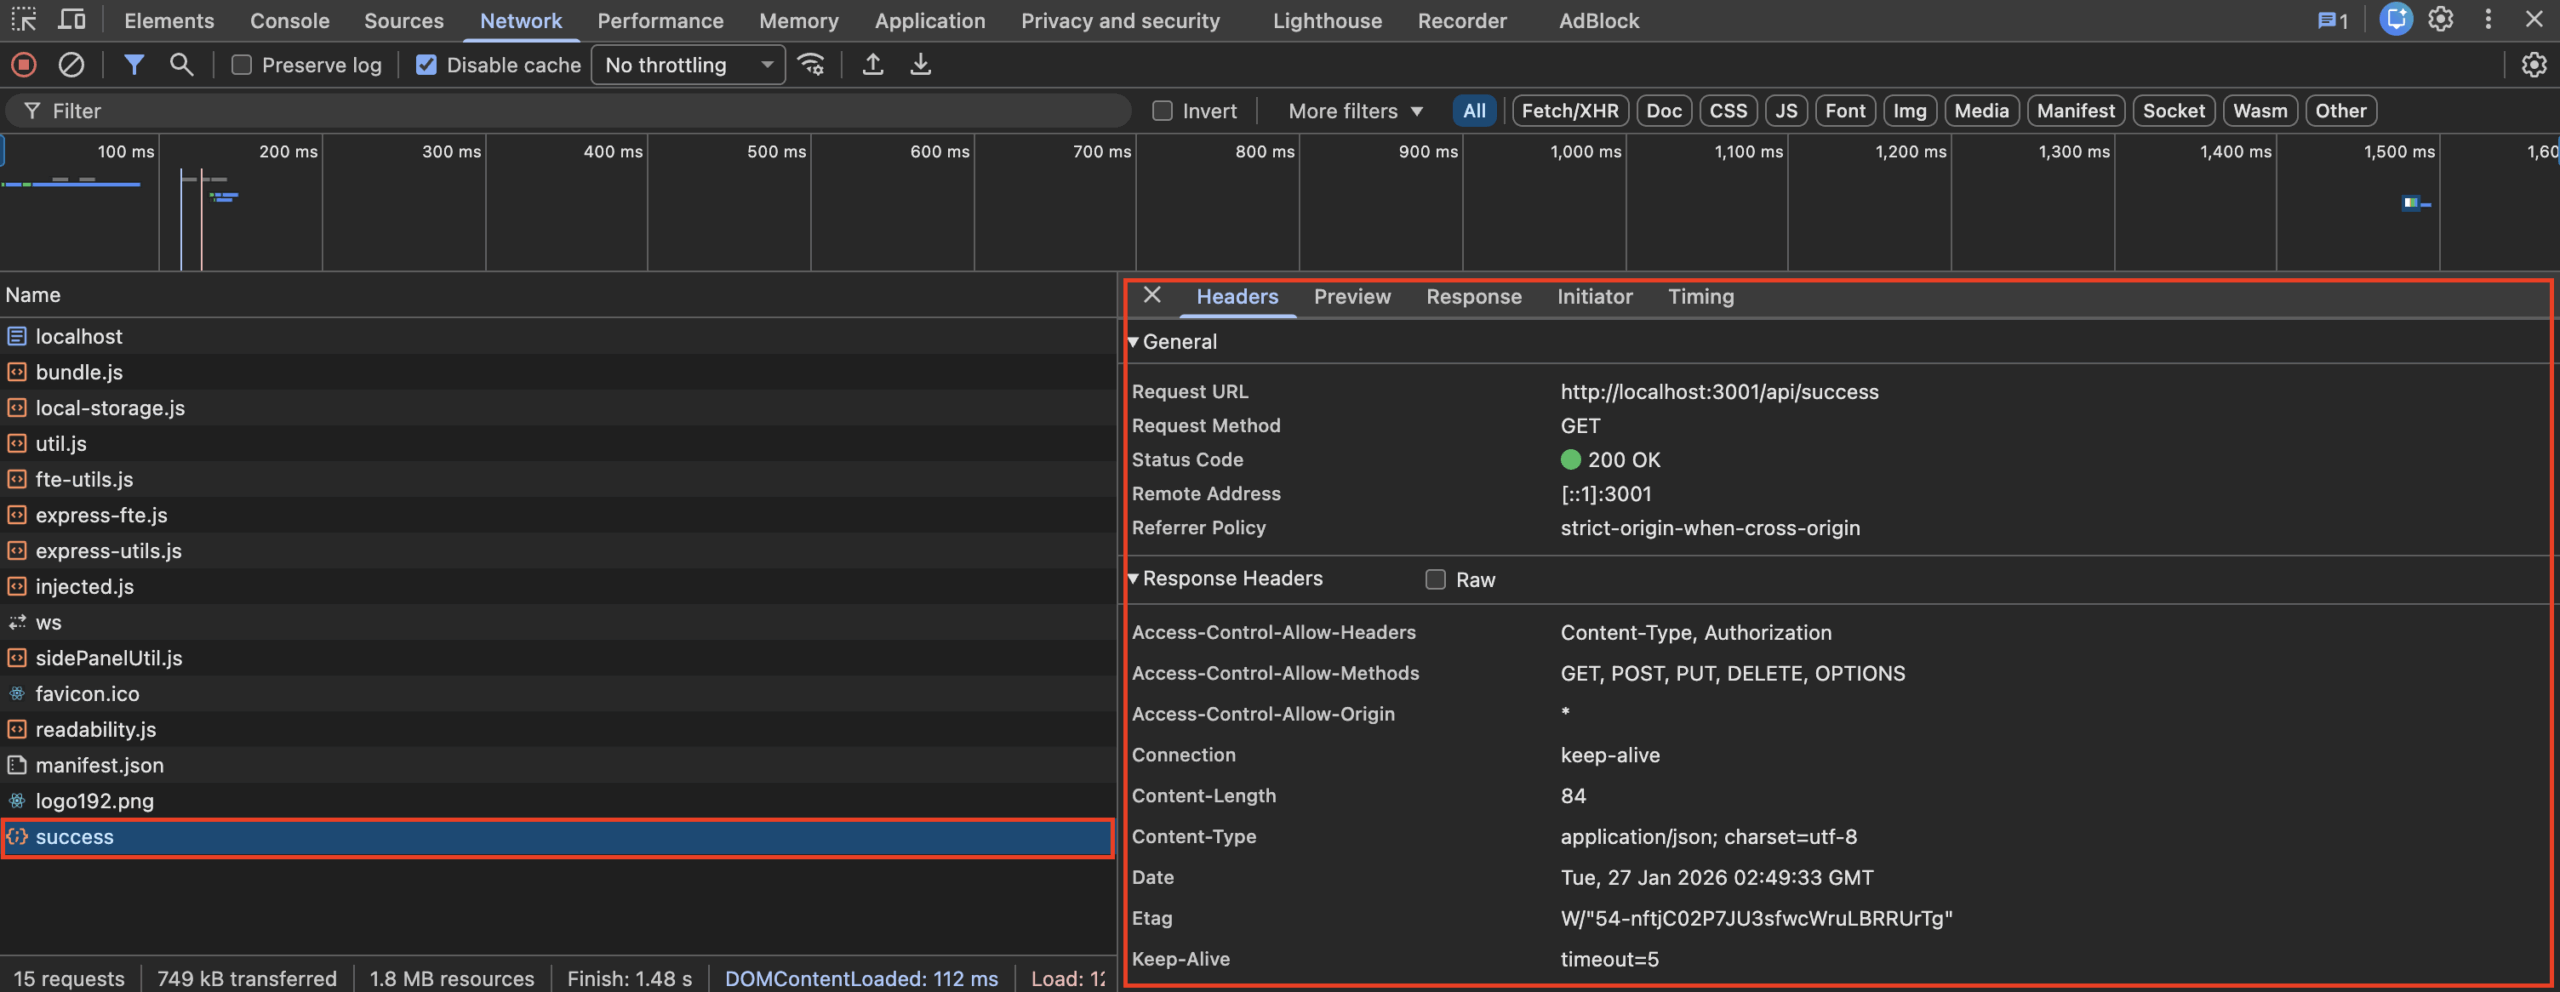
I’ve highlighted a few important sections from this test API call. Starting at the top with the performance monitor, we can see that the request was triggered roughly 1460 ms after the page loaded and took about 20-30 ms to complete. This is indicated by the little bars across the performance chart.
In the lower-left pane, we can see the request itself listed among the other network activity. Clicking on that entry opens the request details pane on the right, where we can inspect it more closely.
Under the General section, we can see several helpful details about this request. It shows the URL the request hit—http://localhost:3001/api/success—which is our test endpoint. The request was made using the GET method and returned a 200 OK status code.
In plain terms, we sent a request to a public URL to fetch some data, and the server responded successfully. Next, let’s take a look at the Response tab.
Minor note: The Response tab shows the raw data returned by the server, while the Preview tab displays the same data in a formatted, easier-to-read view. For the sake of this tutorial, we’ll focus on the Response tab.
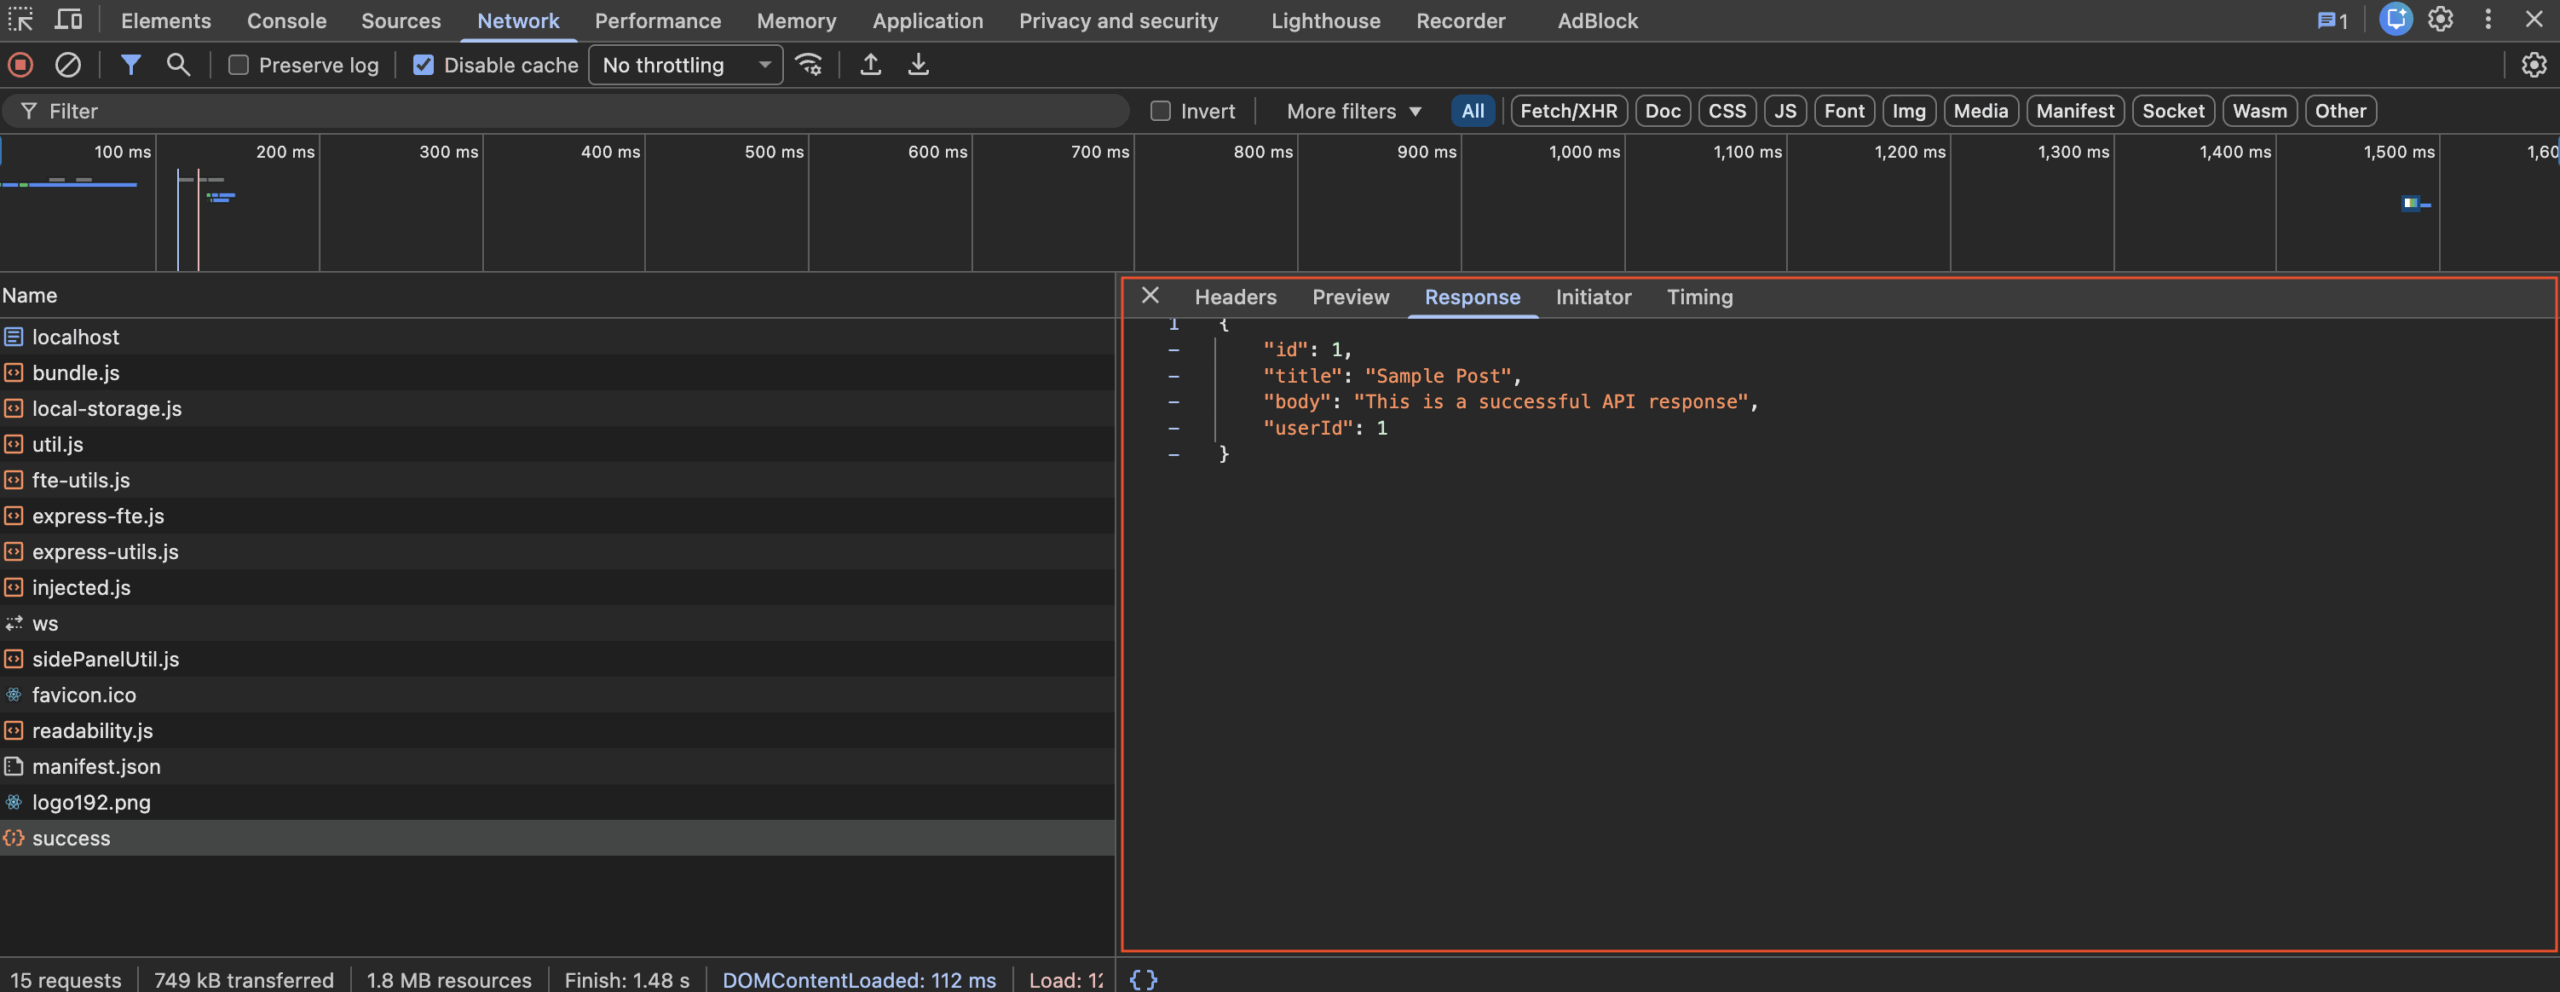
In the Response tab, we can see the data returned by this request. In this case, it’s formatted as JSON and includes fields like the post ID, title, body, and user ID. This is the data our page can use to display content or perform additional processing.
Error Response
Another helpful use case of these network requests is debugging when network requests fail. Here is an example of a failing network request.
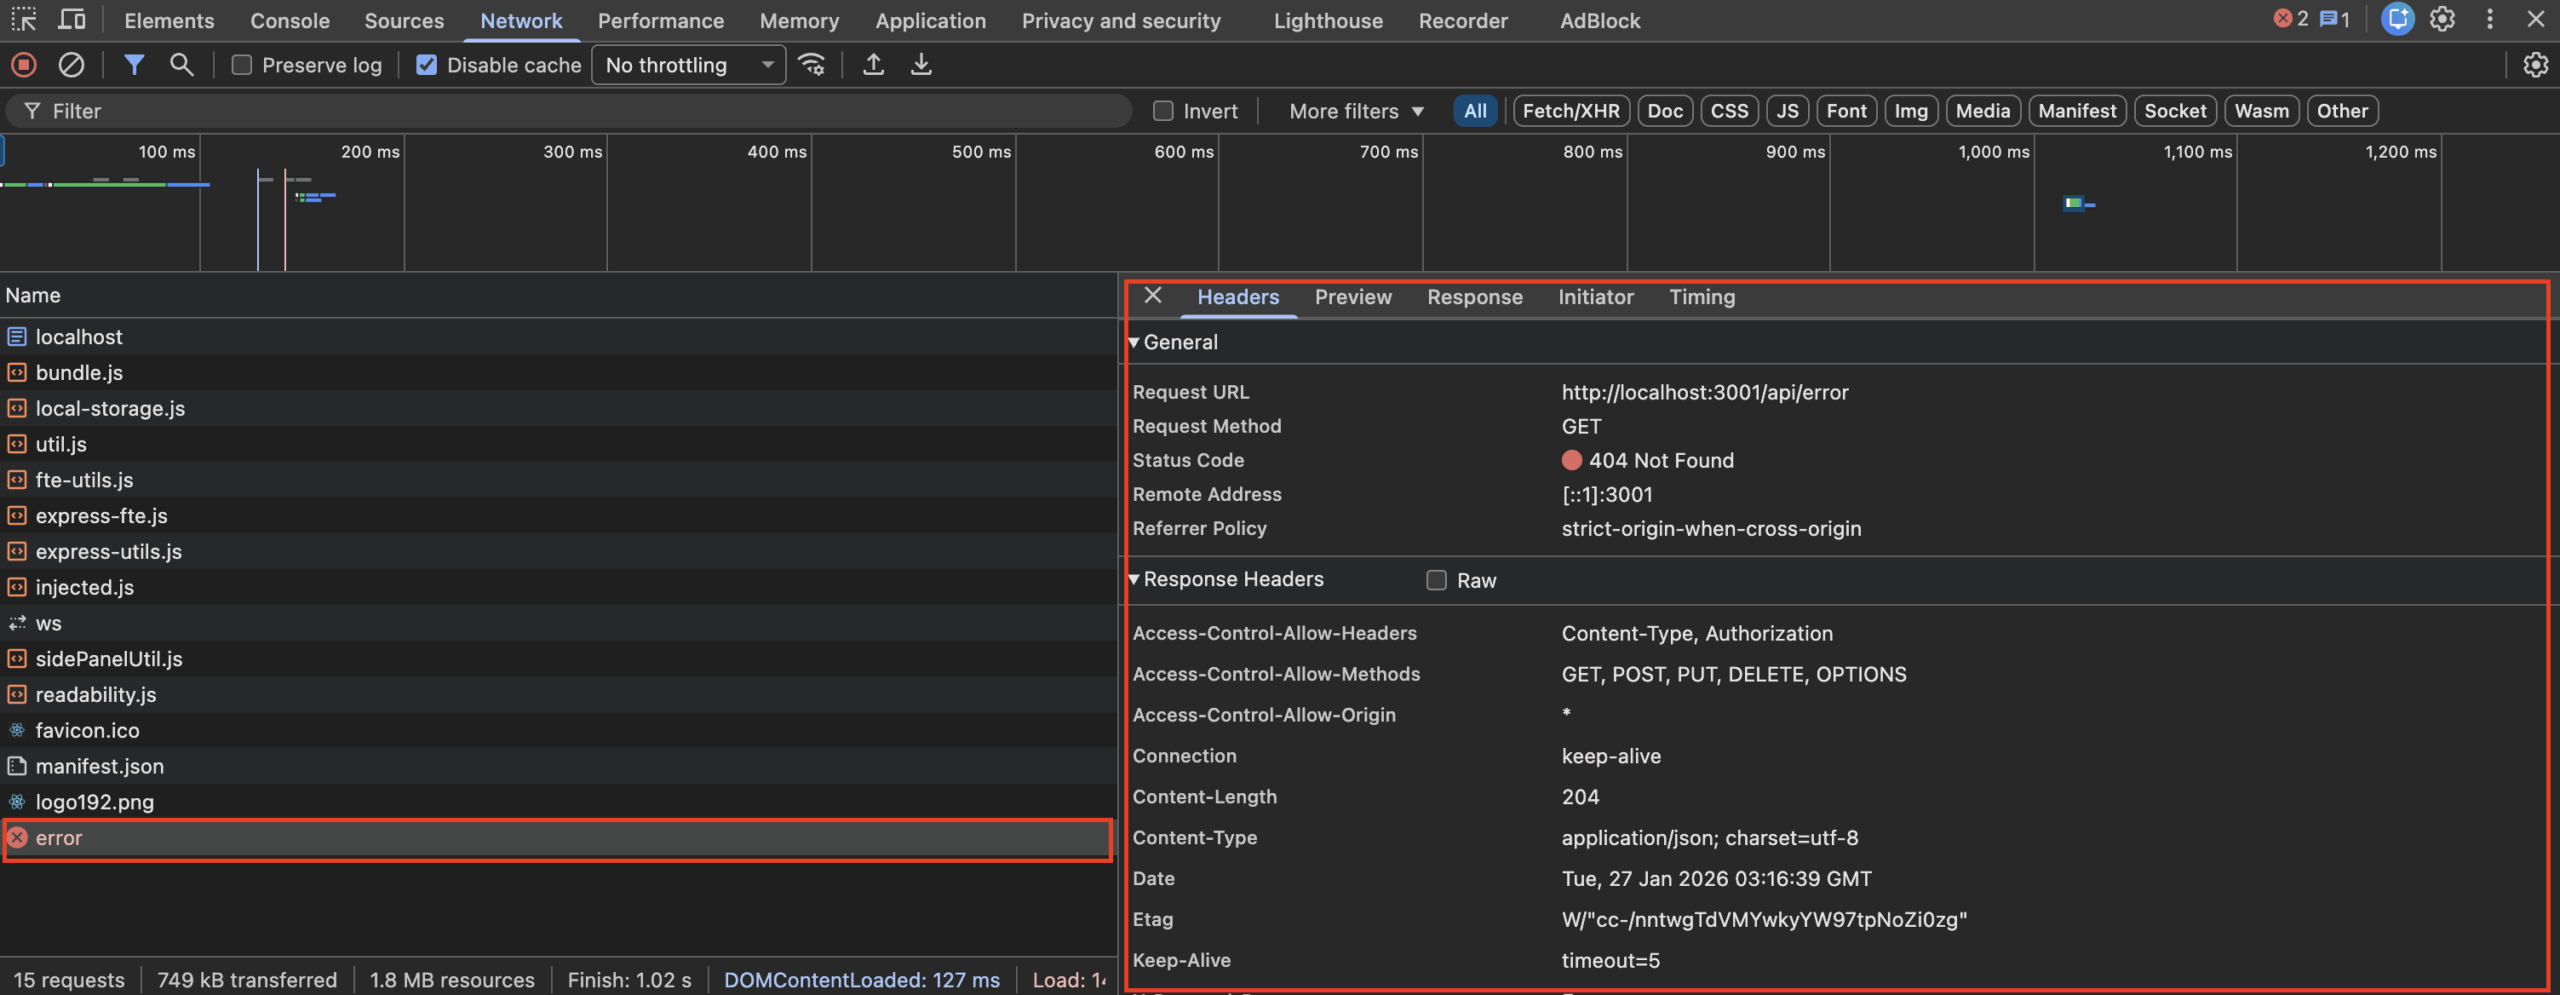
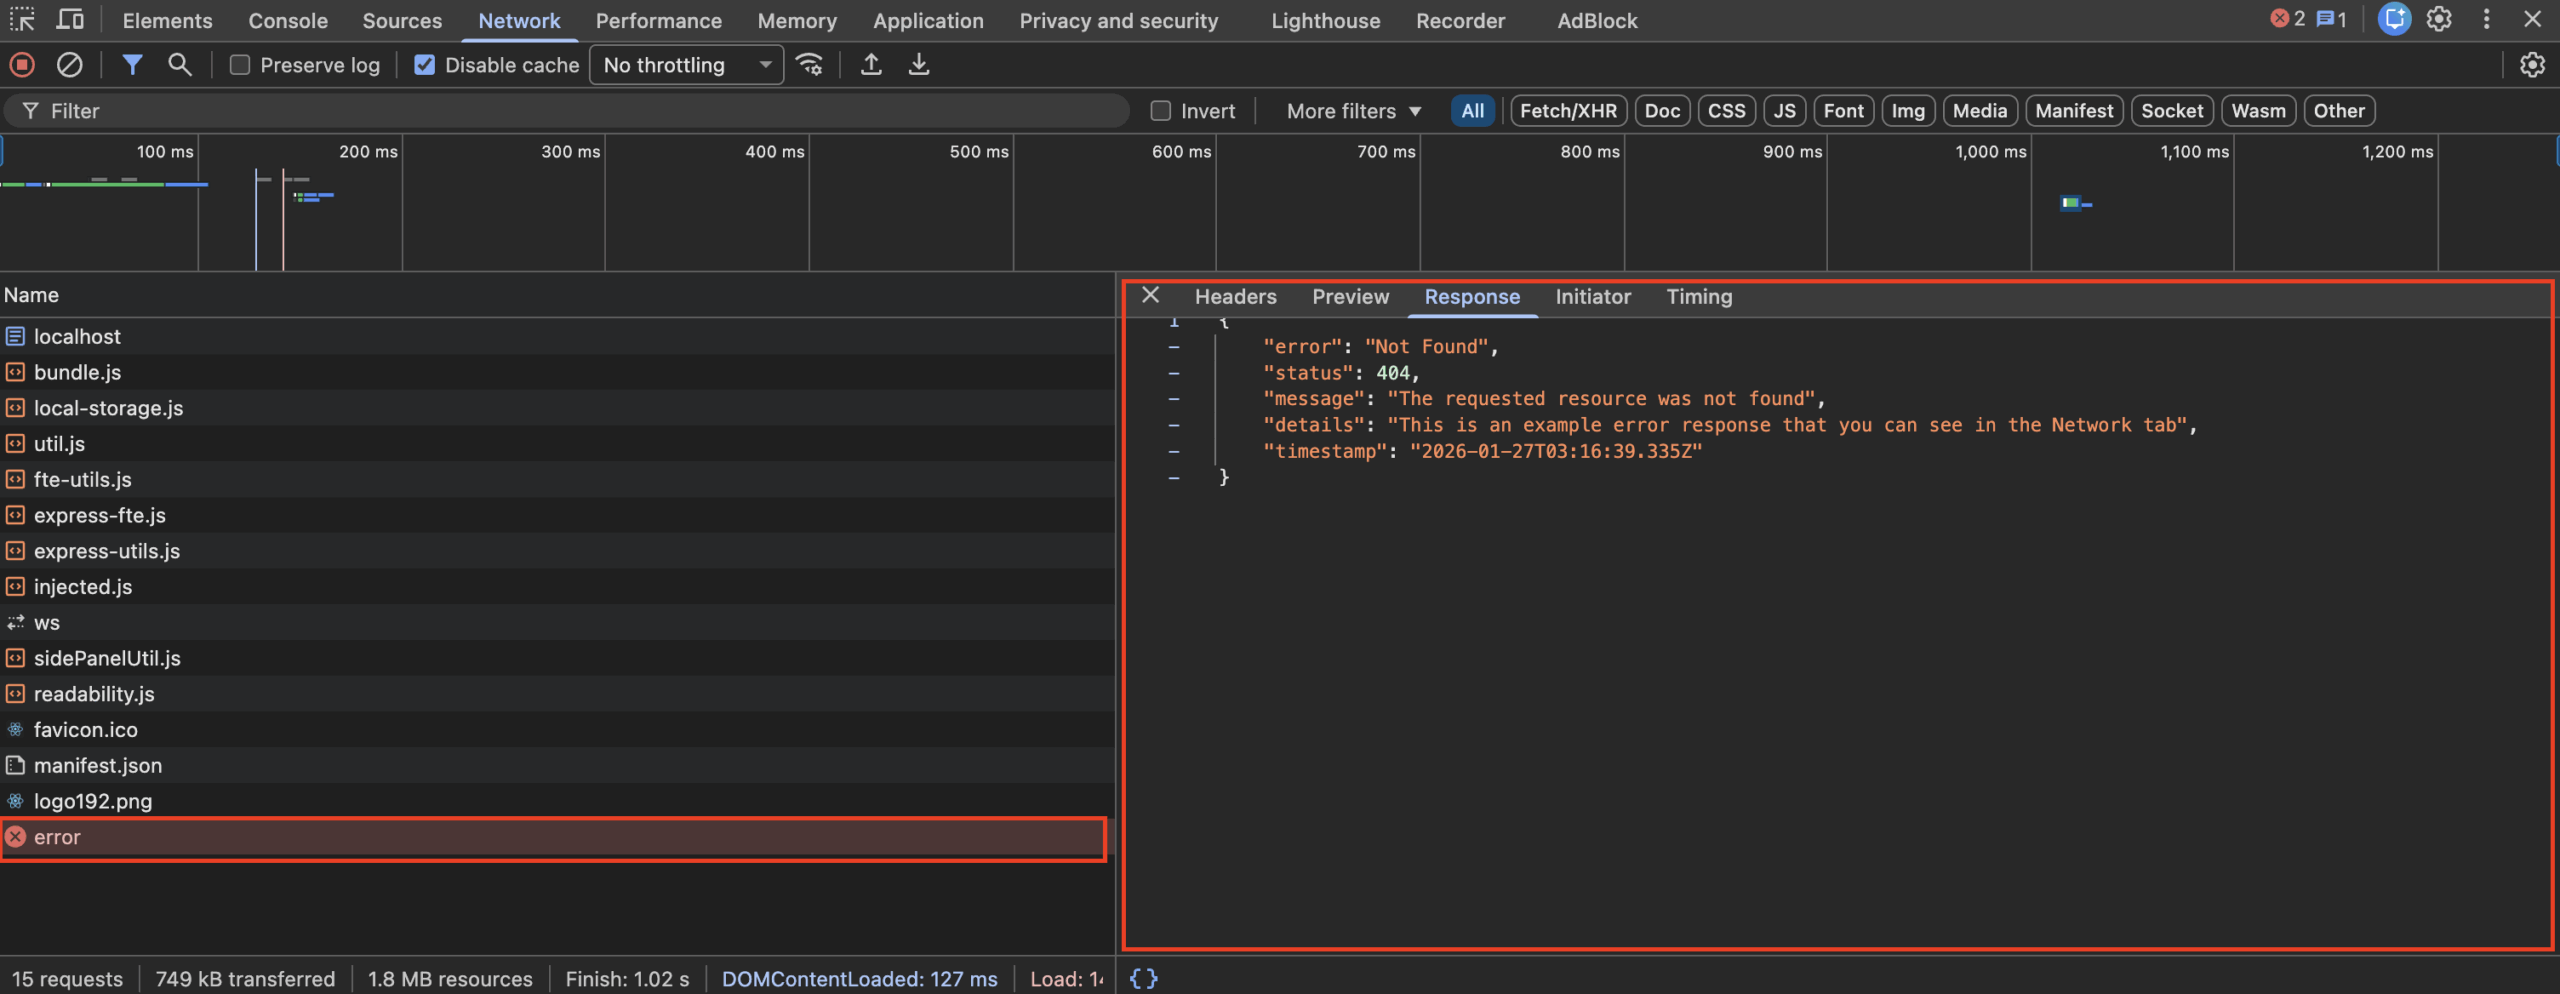
Here we see the network request return a 404 Not Found error, which tells us that the resource we’re requesting doesn’t exist. This information is visible in the Response tab and helps guide us toward a solution. In this case, it suggests that we may be using an incorrect request URL.
This is one of the biggest use cases and workflows that using the Network tab unlocks for every developer!
Bonus Tips & Tricks
Here are a couple of additional tips and tricks that can make the Network tab even more useful. You can find these options in the toolbar (section 1) from the diagram at the beginning of this post.
 This is the Record button. You can toggle it on or off to control whether the Network tab is actively recording requests. When it’s red, the Network tab is recording network activity; when it’s white, recording is paused.
 This is the Clear button. Clicking this button will clear all of the network requests currently shown, if you would like to start from a clean slate.
 This is the Filter toggle. This toggles the filter input. Here you can filter requests by request URL, file name, path, and query parameters. You can also narrow down the specific types of requests by clicking some of the buttons to the right of the filter input.
 This is the Search toggle. This toggles the network search input. This is different than the filter input in that you can search for text from within any network request response body or payload. Think of it as doing a Cmd/Ctrl + F search for any of the network requests.
 By checking this box, all of the request logs will persist even if you refresh the page.
 This checkbox lets us enable or disable the browser cache. Browsers use the cache to reuse previously downloaded data and speed up page loads, but cached data can sometimes cause outdated content to appear after we make changes. Disabling the cache forces the browser to fetch fresh data on every request.
Request Away!
And there you have it. This should give you a solid starting point for using the Network Monitor in your development workflows. Like any tool, it takes time and repetition to get comfortable with all of its features. Hopefully, this becomes a useful addition to your developer toolkit.