Article summary
It seems that despite your best efforts, at some point, you will have to track down a memory leak. In Objective-C, Automatic Reference Counting takes away much of the pain of memory management, but you still need to be careful to clean up after yourself.
There are typically two causes of memory leaks:
- A retain cycle, in which two or more objects have strong references to each other in such a way that they are never released (e.g. A -> B -> C -> A).
- An object is allocated but never freed. With Automatic Reference Counting, this is very rare, although it can still happen if you’re working directly with lower-level classes that don’t support ARC (like some CoreFoundation classes).
A memory leak may manifest as a seemingly random crash when iOS kills your application for using too much memory. Or your app may behave strangely as a result of objects that continue to exist when they should have been released.
When trying to find a memory leak, a good first step is to run the application and watch the memory usage graph in Xcode. If the memory usage tends to increase as you use your app, then it’s likely that some memory isn’t being released appropriately.
Enter Instruments
The Instruments tool provided with Xcode can give you valuable insight into the lifetime of objects used throughout your application. To get started, connect your testing device. (It’s best to use a real device for this, since the Simulator doesn’t always behave like a real device, especially when it comes to low-level details.) Then, in Xcode, go to Product -> Profile, which will compile your app and start Instruments.
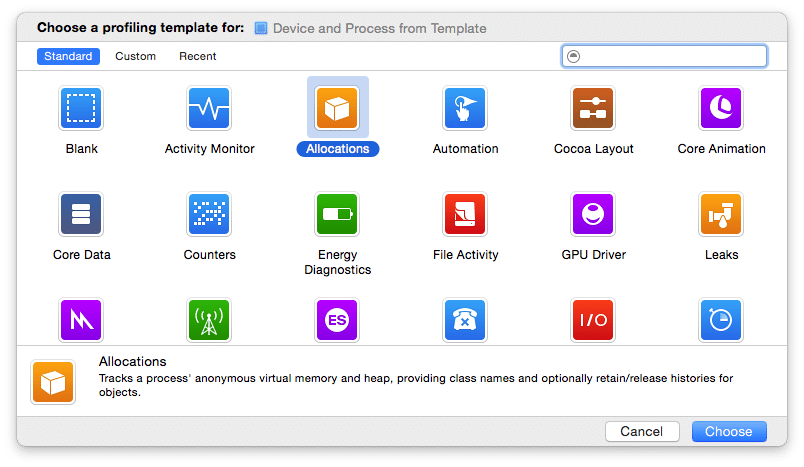
Under “Choose a profiling template for,” select your device and application (see troubleshooting if it’s disabled). Then select the Allocations instrument and click “Choose.” (It’s worth noting that the Leaks instrument can also be useful, but it is primarily used to detect memory that is never freed, not memory leaks from retain cycles.)
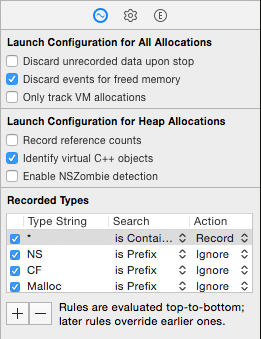
Now configure the information that Instruments should capture:
- Discard unrecorded data upon stop: Instruments tends to capture more information than it can process in real time. Uncheck this option so that it will finish processing any queued raw data when you hit Stop.
- Discard events for freed memory: Enabling this will make it much easier to navigate the data that Instruments captures. We’re trying to find leaked memory, so information about objects that have been allocated and released correctly isn’t very interesting.
- Record reference counts: In our analysis, an object that is still listed will have a reference count greater than one, so the specific value is not all that important. But it can be interesting to go back later and see where an object was retained and released. Leave this option unchecked for now since it can really slow down your app.
- Recorded types: If you already have some idea of which objects are leaking, you can filter the recorded types here. At a minimum, you should check the options to ignore types with the prefixes “NS,” “CF,” and “malloc,” since these are all iOS-specific or low-level functions. (These types of objects may leak, but typically it’s because something else at a higher level leaked them first.) Reducing the amount of information that Instruments has to capture and process will keep your app from bogging down too much while Instruments is attached.
Now click the record button to launch the app and begin recording. You should start to see a graph of the memory usage on the Allocations track.
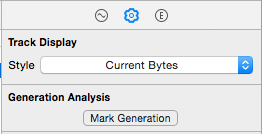
 Click the gear button to switch to the Display Settings tab and notice the “Mark Generation” button. Every time you click this, Instruments will tag all of the objects allocated since the last generation. This will allow you to find objects that are not being deallocated properly. For example, you might have a screen that allocates a bunch of objects (e.g. UIViewControllers, views, and other custom classes) and you expect them to be released when the screen is dismissed.
To try this, first click “Mark Generation” to mark long-lived objects (e.g. singletons that will exist for the life of the app) and any objects associated with the current view. Then navigate to the screen that you suspect is leaking memory. Click “Mark Generation” again to tag all of the objects just allocated for this screen. Check out the “# Total” column for the current generation–it may be a high number now, but when you navigate away from the suspicious screen it should return to zero! If it doesn’t, then it means some objects still haven’t been released (it may also take a moment for Instruments to catch up. Hit Mark Generation again to encourage it to update its counters). Depending on the design of your app, these objects may have a legitimate reason to still be around, so it’s usually best if you can repeat the procedure a few times. But in many cases, if the “# Total” does not return to zero, it’s likely a memory leak.
 Click the arrow-in-a-circle next to any generation name to focus the analysis on just the objects created during that generation. There are a couple of tools that can help narrow down the source of the leak. You can select one from the navigation bar in the center of the window (click where it currently says “Generations”). These tools include:
Allocations list
This will list all of the objects in the generation that are still “live” (that is, objects that have not been released). However, many of them will likely be red herrings. It is important to understand that when a parent object is kept in memory, so are all of its child objects. For example, you may see many instances of CoreAnimation or UIKit classes if you have a view that is sticking around longer than it should. Unfortunately, Instruments can’t tell you exactly where the problem lies. But if you see an object that you suspect should have been released, double-click it to jump to the source and see where it was allocated. This should at least give you a good starting point to begin combing through your code.
Call trees
It’s best to root out the biggest leaks first, so sort the “Bytes Used” column in descending order (if it’s not already). This view will show you which methods are responsible for memory usage by size. You can drill down into subsequent methods by clicking the triangle next to a method name (tip: press Option+→ to expand an entire tree). Like the allocations list, examining the call tree can also give you a good starting point for finding the leak. Look at the “Responsible Library” column to see where a particular method is called. Since the memory leak is most likely in your own code, focus your search on methods belonging to your project.
Back to the Code
When you think you’ve found an object responsible for a leak, the quickest way to confirm your suspicion is to just comment out the code where it’s used. Run your app again (from Xcode, so that it recompiles; just stopping and starting Instruments will only run the same binary) and repeat the procedure as above, marking generations as you go. If you see the number of objects return to zero, congratulations! You’ve found the memory leak–now you just need to figure out how to fix it.
Troubleshooting
Getting Instruments to work the first time can be a task in itself. For reference, here are a number of issues that I faced. Fortunately, the age-old advice of try turning it off and on again tends to get it working (quit Instruments, quit Xcode, disconnect the device, reboot everything). I hope this helps!


Other potential issues include:
- Pressing the Record button may appear to have no effect (the timer starts counting up, but nothing is graphed or added to the logging window). Disconnect and reboot your device.
- Instruments displays hex addresses instead of symbolic method names. Make sure you are launching Instruments from your project in Xcode and not just running Instruments directly.
- Your device appears in Instruments, but you can’t select it because it’s disabled. In this case, ensure that the version of Xcode you are running supports the version of iOS installed on your device (you can confirm this by checking under Window -> Devices in Xcode).
Hopefully, all of this will help you track down and fix those memory leaks.


Awesome and very useful post! If you ever have the desire to create a similar post on Instruments techniques to identify poor scrolling performance in Tables, I would be eternally grateful ;)
Thanks for posting this, Brian! Very helpful when starting out with debugging memory problems in iOS applications. Would love to see more from you on memory management and debugging techniques.
Thank you for taking the time to write this post. I’ve worked with older versions of instruments before and this new version kind of threw me off. This has proven a very helpful resource in tracking down memory leaks in a few apps of mine. :)
Thanks for the post, it helped.
This was a huge help in remembering where to go in instruments. I only use it once in a blue moon, and it’s always different than the last time I opened it.
I am unable to find the # Total column in Xcode 7.3.1’s Instrument’s UI. I have only “Snapshot”, “Timestamp”, “Growth”, and “#Persistent” columns. Anyone having the same issue?
Ok, I found it in Leaks instrument, not in Allocations.
Thank you for the article.
I wonder, how to catch C++ memory leaks on iOS using this tool? I have some cross-platform libraries with C++ code. As a test, I have added
int* foo = new int[10];
foo[3] = 23;
foo[8] = 45;
printf(“%d %d\n”, foo[3], foo[8]);
foo = NULL;
code to a touch event in my app (renamed controller to .mm for C++ to work), but still Leak section does not report anything, no matter how often I click the button. Clearly, foo should be leaked, right? How do I see it in the Instruments?
Martin,
I think the Leaks instrument will only look for leaks among Objective-C objects. But I actually have not found the Leaks instrument to be reliable even for that. Instead, I rely on the Allocations instrument, using heapshot analysis to find retain cycles.
Hi Brian
Great article and I always seem to be learning something new in the changing world of Instruments. What I will like to bring to the attention of your readers is that access to “Recording Options” has moved to a menu in version 8 of Instruments:
File->”Recording Options…”