Atomic is currently collaborating with “IDEO”:https://ideo.com on a consumer-facing web app. The integration of IDEO’s user-centered design practices with Atomic’s software design and build practices is a powerful combination for our client. Working with an old friend and getting to know some more of the smart, talented people at IDEO have been great. We’re learning new things and refining our own UX practices.
Studying potential users of the app we’re creating is an important part of the project. The research being done is a clear example of IDEO’s “start with people”, design thinking process, as described by “Tom Kelley”:https://www.ideo.com/people/tom-kelley at a recent “Design West Michigan”:https://www.designwestmichigan.com/ meeting. At our project kickoff, I had one of those delightful moments of finding my intuition entirely at odds with what was being presented, when our IDEO colleagues described how they selected research subjects.
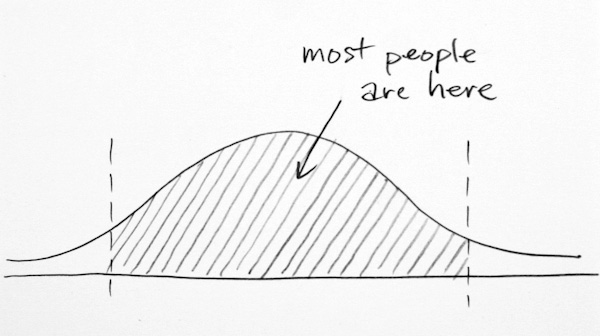
If you drew a distribution of people’s behavior (or expertise or passion or knowledge in the domain you’re studying), you might find it looks like the curve below. It doesn’t matter whether this distribution is actually Gaussian or not–I doubt anyone actually knows, and it probably varies by domain. The point I’m describing doesn’t depend on the specific distribution.
The question is, where should the people you select for research lie on this distribution?
The answer which seems obvious to me is you would want typical users, or the ones that clump up around the middle of the distribution. After all, for a broad, consumer-facing app these people represent most of your potential users. You may never have budget to build features for the “outliers”. Your business success depends on delighting the majority of people. So of course, to understand the problem and design the best app, you should concentrate your research on the middle of the distribution. Makes sense to me.
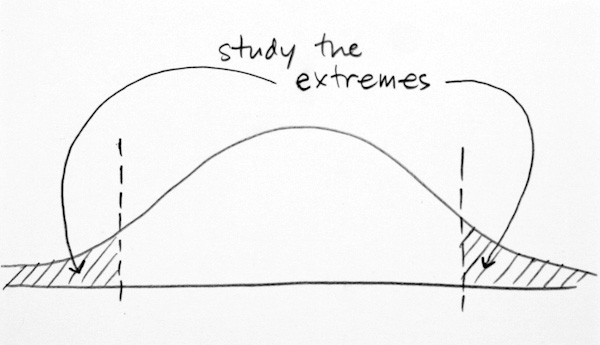
What the IDEO researcher surprised me with is the sketch below showing how they look instead to the extremes of the user population:
The point our colleague made is that since research is all about learning, a very fast and efficient way to learn is by studying the extremes. The issues that are relevant to all users are most clearly visible in the extremes of the population. In the great middle the “signals” you’re looking for will be a lot less obvious and buried in more “noise”. By closely observing the extremes of the community you learn more quickly what’s relevant to everybody, and hence to the application you’re building. Counter-intuitive, but it made a lot of sense once I heard it.
Here’s how this approach might work for Kidtelligent, a web app we built last year. The users of Kidtelligent are parents of 7-10 year olds. The app helps parents, mostly mothers, understand their kid’s personalities and gives practical advice on how to help them succeed in relationships, school, sports, etc. If the dimension of consideration for researching moms was “familiarity with behavior profiles and web tools”, then going to the extremes would mean finding moms who had never heard about such profiles and seldom used computers, on one end of the spectrum, and moms who were clinical psychologists and expert computer users, on the other.
What would we learn from each group? I wish I could say. We didn’t use this technique on that project. Maybe, from the naive group, we would have learned more quickly the issues moms worry most about for their kids, independent of the behavior assessment. Maybe, from the expert group, we’d learn the most valuable measures to provide in the report (which did they put the most emphasis on, given their expertise?) In any case, by studying the extremes, we might have learned more quickly. The important issues might have been surfaced more distinctly compared to observing average moms who were typical computer users somewhat familiar with behavior profiles.


