If you’ve read some of my prior posts, you’ve probably realized that I enjoy tinkering with the Raspberry Pi. I’ve recently been working on a web application for the Pi that uses a database to store some data. The application didn’t require multiple users or special access features, so I decided to go with the simplest approach I could think of: SQLite. This ended up being much more difficult than I ever would have imagined.
Unexpected Slow Speeds
The Raspberry Pi is an amazing little contraption. It’s basically a full-functioning computer compressed to the size of deck of cards. But anyone who’s used one could probably tell you that it’s not the fastest machine in the world. We have grown accustomed to the speed and responsiveness of multi-gigahertz processors, and the mere 700-megahertz processor in the Pi is noticeably slower at most tasks.
This leads me to my problem. In the web app I was working on, I found that a certain button click event was causing the entire application to lock up and become unresponsive for over 10 seconds! I dug into what was happening and found that, in that situation, the contents of a table in the database were being deleted, and about 20 new rows were being added. To me, that doesn’t seem so bad, and certainly shouldn’t take 10 seconds. I could write the new entries on paper in that much time!
I was using ActiveRecord to access the data, and I first thought I must be configuring or using it wrong. I tried structuring my ActiveRecord classes differently and making sure multiple processes weren’t trying to access the data at the same time, but no matter what I did, there was no performance improvement. One of my coworkers suggested that I try using the SQLite command line interface to insert and delete rows from a database to see the problem was with SQLite itself. It didn’t take me very long to confirm that that was the case.
I was shocked to find that a single insert statement took anywhere from 2 to 5 seconds! That’s an eternity in computer-land, and completely explains the massive delay I was seeing in my application. One quick look at the SQLite documentation and you will see that there are quite a lot of configuration settings that can be changed to tweak performance to your needs. I set out to profile and optimize SQLite for use on my Raspberry Pi application.
SQLite Optimization Experiments
I wrote a simple test script that creates a database, and then performs 100 cycles while recording the time. Each cycle inserts 5 records into the database, deletes the records, and then inserts 5 more. First I tried running the script with the default settings. The results were, as expected, very bad. In fact, it took so long I had to terminate the script because it was taking so long. Each cycle was taking about 30 seconds.
Switch to Single Transaction
The first optimization that I tired was wrapping the inserts and delete into a single SQLite transaction. The SQLite documentation indicates that including many operations in a single transaction will increase performance. The chart below proves this to be true. Each cycle now takes approximately .01 seconds to complete with an occasional random spike of .025 seconds. This is a significant improvement over the 2-5 seconds per operation that I was seeing before.
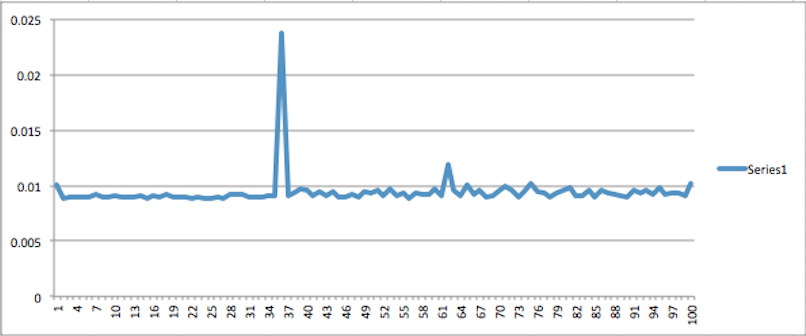
One thing worth noting is the total test time. Each point on the chart represents the time that it took for one cycle of the test. The total test time is the sum of all the cycles plus any overhead from starting or stopping transactions. For this first optimized run the total test time was 3.53 seconds. If we add up the times for all the cycles the sum is only 0.94 seconds. That means there was about 2.59 seconds of overhead while using this method.
Write-Ahead Logging
The next optimization that I tried was something called “Write-Ahead Loggging” journaling mode (Also known as WAL mode). Journaling is a technique that SQLite uses to ensure that the database does not become corrupt in the event of a power failure or system crash. It also allows for atomic transactions. Journaling involves storing changes to the database in a separate file and then merging the changes in at later time. You can read more about WAL journaling mode.
For this test, I did not group the inserts and deletes into a single transaction; each operation is a separate transaction. From the chart below we can see that using WAL journaling mode is also a significant improvement over the default settings. However, notice the spike at cycle 91. I believe this is the point at which the database is performing a checkpointing operation. Checkpointing is where the journaling file is synchronized with the actual database file. This operation took 4.5 seconds to complete, which might be problematic to your application if it occurs periodically. Also notice that the very first cycle took about 1.25 seconds.
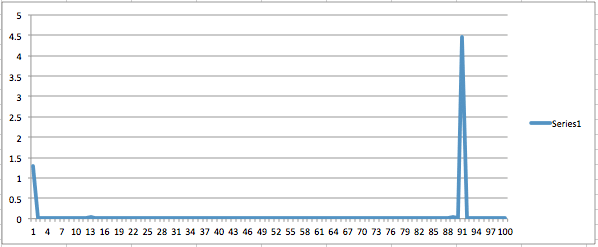
The total time for this run was 7.19 seconds. That is almost double the total time of the first run. It is interesting, though, that the sum of all the test cycles was 7.17 seconds. This means that when using WAL journaling mode, more delay occurs at the time of doing the actual inserts and deletes, but there is very little overhead involved with beginning and ending transactions.
Write-Ahead Logging & Single Transaction
The third test was a combination of the first two. I set the journaling mode to WAL and grouped the operations in a single transaction. I expected this run to be much like the first optimized run but without the spike of 0.025 seconds. Unfortunately, that was not the case. I believe the reason for this is that regardless of the journaling mode and transaction technique, the database still has to occasionally flush the data to disc.
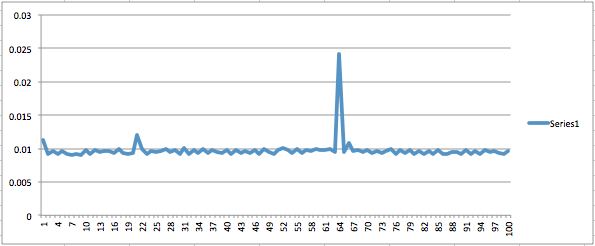
The total test time with WAL journaling mode and single transaction was 2.29 seconds. So although the average cycle time did not change much from the first optimized run, the transaction overhead is over a second less. That is still a significant improvement.
Write-Ahead Logging, Single Transaction and Checkpointing Off
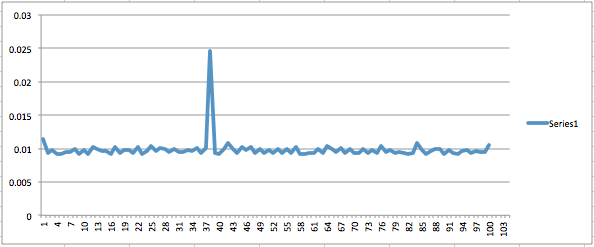
The last test that I did was the same as the previous test but with Checkpointing turned off. I expected this configuration to be the best by far, but it turned out to be not much better than the previous test. The average cycle time was just about the same, and the total test time was only 0.004 seconds shorter.
Summary & Conclusion
If your goal is to improve performance using SQLite, definitely try to group as many operations as you can into a single transaction. My testing demonstrated that this can provide significant performance increases. Research the pros and cons of using WAL journaling mode and consider enabling it on your database. If for some reason your application design does not lend itself to grouping operations in fewer transactions this would be a great way to speed up your data access times.
Finally, I didn’t see much difference in performance when turning off checkpointing, but the documentation says that you can use it to adjust the frequency that checkpointing occurs. This may be helpful as well.
With RPi, everything is stored on the SDCARD, so the speed of that card can make a big difference. I’ve recently switched to buying only Class 10 cards. They cost just a little bit more, but I have noticed a significant speed difference compared to the cheapest cards (Class 4 usually).
Based on some experiments, slower SD media appears to be the culprit. I made a script that did a table create and insert for SQLite, then ran it on my Raspberry Pi at home (which has a class 10 card). It had an order of magnitude less latency: rather than seconds, it consistently took about 200 milliseconds. Still on the slow side, but more in line with what I’d expect.
The SQLite data written was relatively small, so what we’re seeing probably has more to do with fixed costs for flash sector erases and page writes than overall data throughput. SQLite is ensuring the data is actually written, rather than just in a disk write cache, so the latency is particularly visible.
Sorry, forgot the relevant link http://en.wikipedia.org/wiki/Secure_Digital#Speeds