I have recently been playing around with plato, a JavaScript static analysis and source code complexity tool.
Plato utilizes a node module called complexity-report to generate a report with statistics about various aspects of your source code. The plato Github page contains sample reports for a few notable project repositories: jQuery, Grunt, and Marionette. Each plato report includes the following statistics for each source code file:
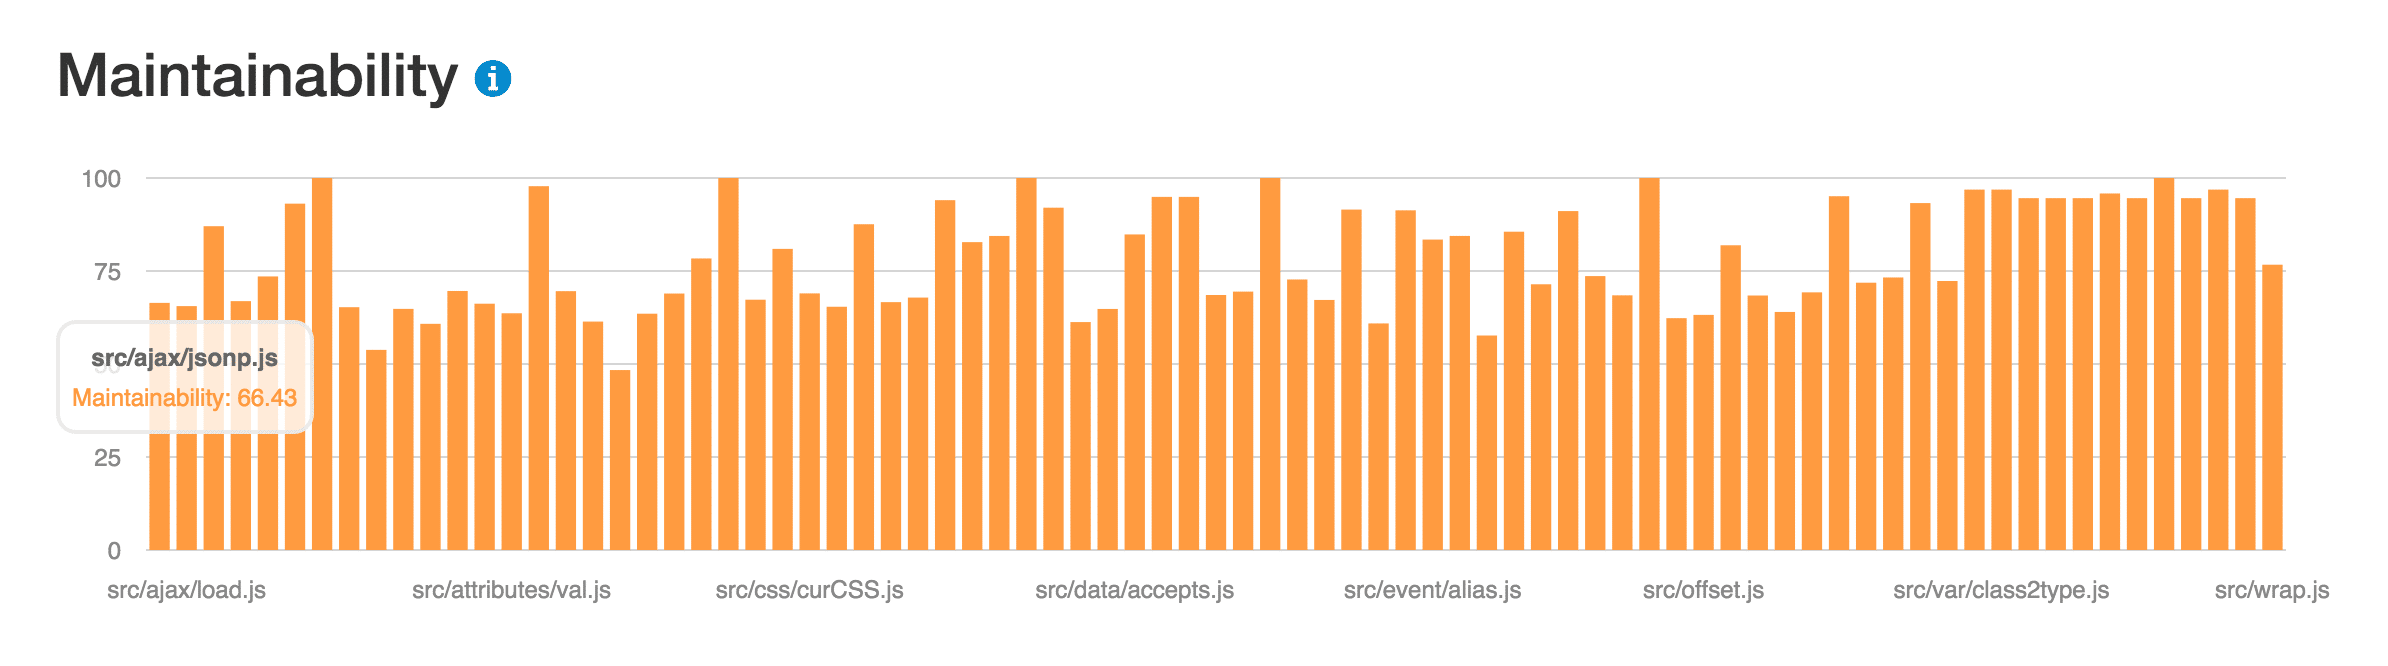
1. Maintainability Score
The maintainability score is explained here. The score considers the Halstead volume, cyclomatic complexity, and the line count for each source file. For jQuery, this chart looks like this:
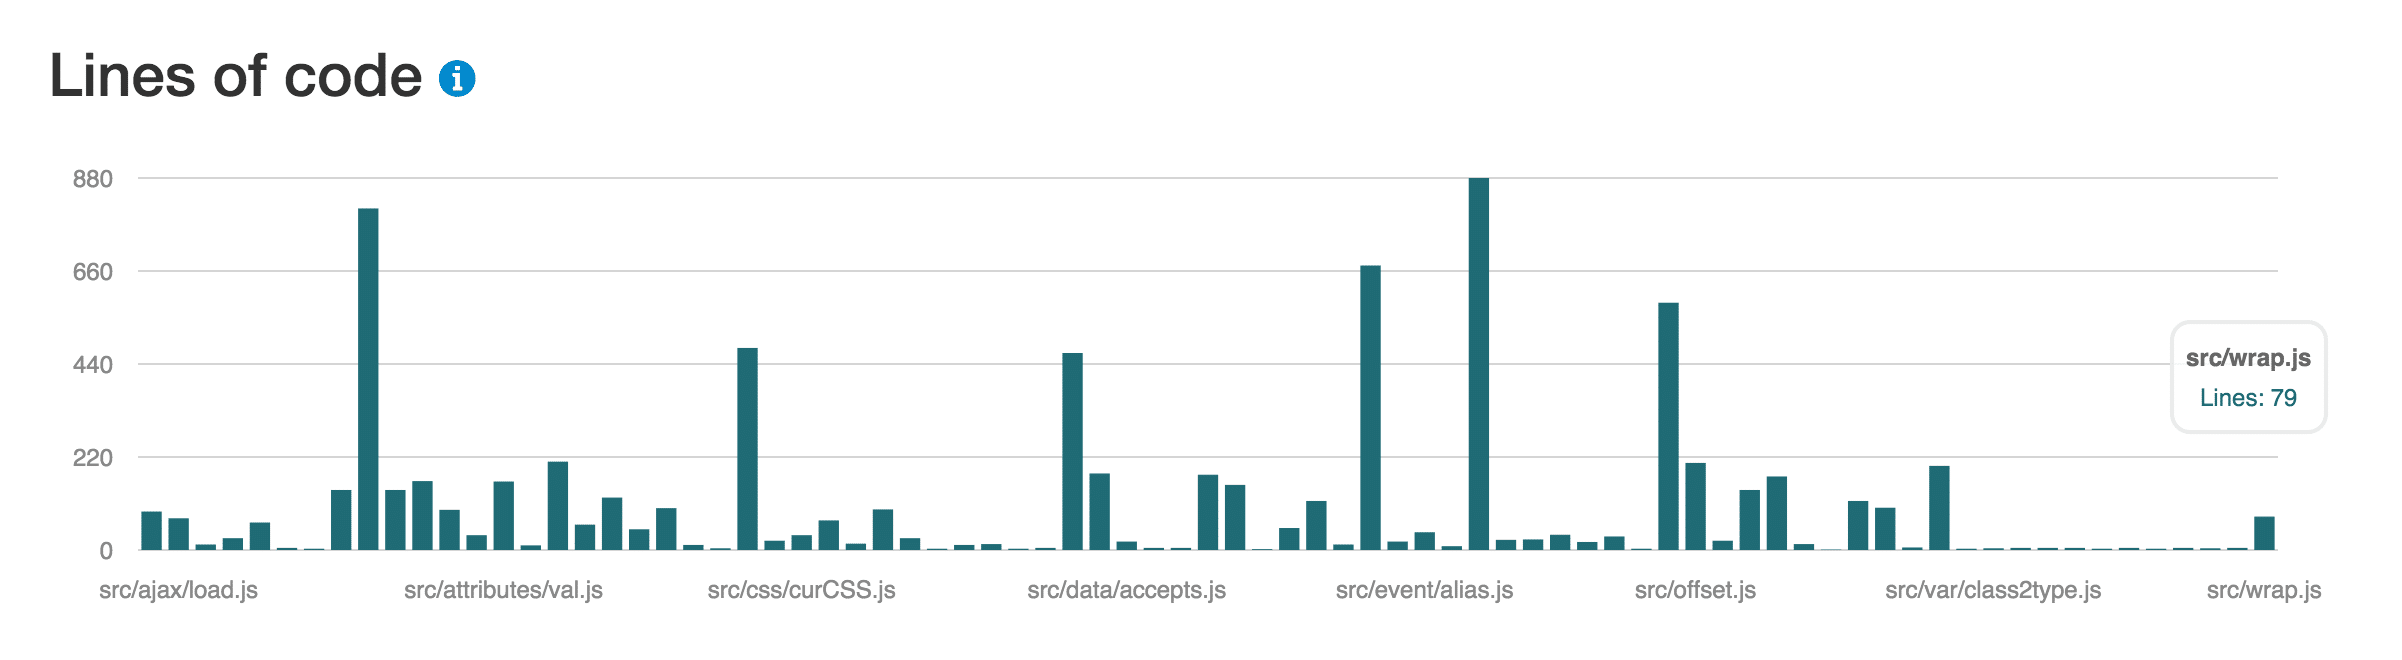
2. Lines of Code
The lines of code graph helps identify large files, which are typically indicative of code that should be broken down or simplified. The lines of code distribution for jQuery is as follows:
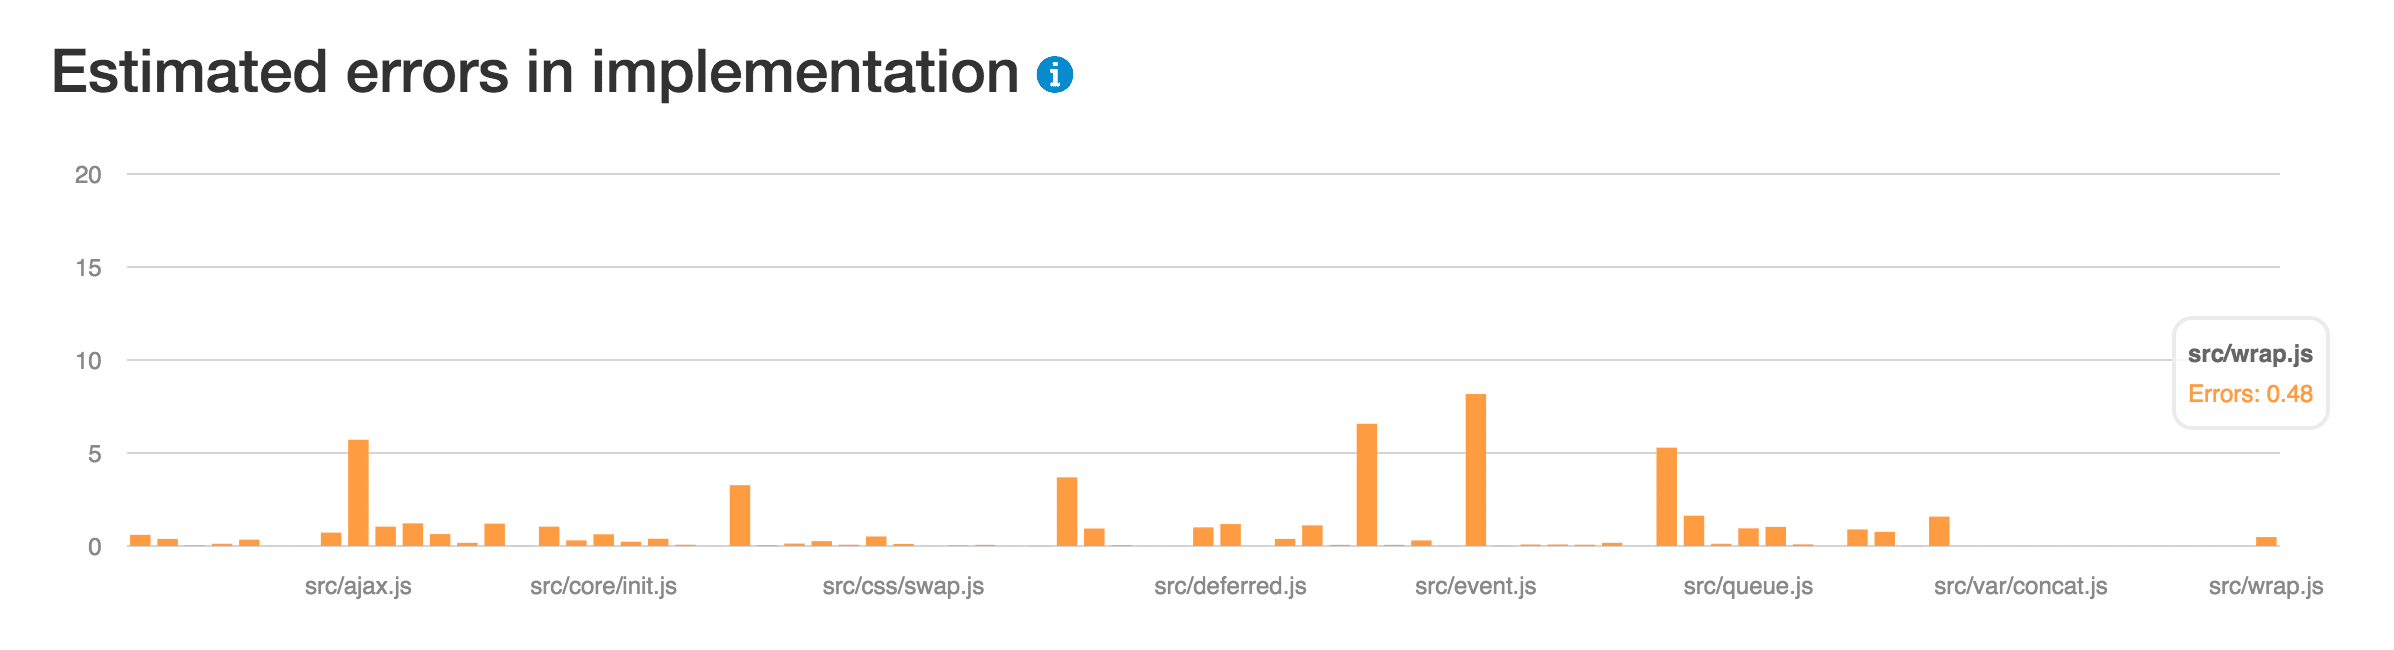
3. Estimated Error Count
This number is calculated using the Halstead-delivered bug score.
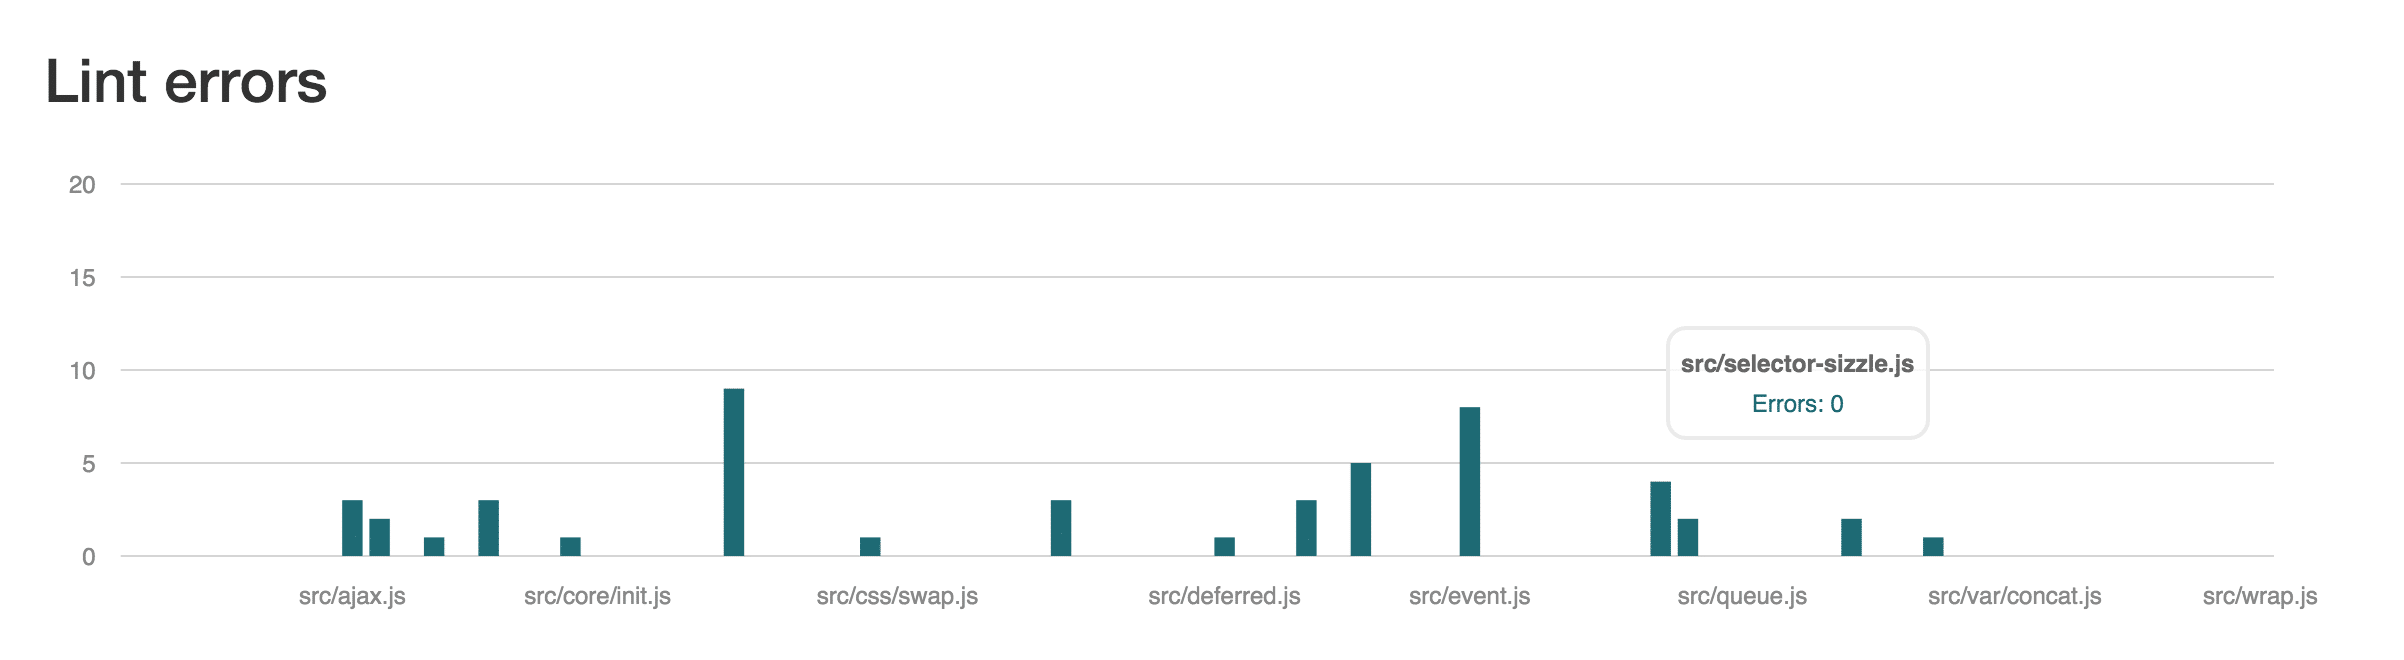
4. Linter Error Count
Plato gets linter data from JSHint and ESLint. Depending on how your team likes to operate, you might not allow any linter errors in your production code. The linter error graph is a nice way to ensure that a certain level of cleanliness is maintained across the project.
The report also allows you to sort your source files by each of the above metrics. You can drill down into a specific source file to get a more detailed file-specific report which includes statistics for each function in the file.
ES6 Limitation
It appears that the complexity-report module that plato depends on does not currently support ES6 JavaScript features, and plato will exclude files that contain any ES6 features in its report.
Usage Model
Plato can be installed via npm and run from the command line. You provide a root directory to plato, and you can control whether it recurses on other directories by passing in a flag. Flags can also be passed in to specify JSHintrc or ESLintrc files for linting, among other things. Additionally, plato can be imported and invoked programmatically like any other node module.
We currently have our CI server configured to produce a plato report on every CI build. Most of the time, these reports are just ignored, but it’s nice to have them available to inspect from time to time.
It’s important to understand that the reports generated by plato, like any other software metric, must be interpreted mindfully. I like to use them to get a high-level idea of how complexity is distributed within a project. Files with a disproportionally large number of lines of code or high complexity score are good candidates to investigate to see if further simplification is warranted.
Just a heads up… I have released a next gen complexity analysis package `typhonjs-escomplex` which supports ES6 / 7 / edge JS and plato now uses it thus plato supports all modern JS for creating reports. The latest 1.7.0 release of plato will work for ES6 and beyond.
Thank you guys! I searched for it
Hi Matt,
I just read your article on plato package. I am trying it out myself for a nodejs/express project we are starting up. It’s important I exclude certain directories from the metrics. I am having issues with excluding more than one set of directories. Can you help?
I wrote this command line and its not excluding…
plato -r -d report -n -x “node_modules^|public^|\.vs^|obj” Project
If I write…
plato -r -d report -n -x “node_modules” Project
That works
I need node_modules, public, and obj to be excluded.
Thanks