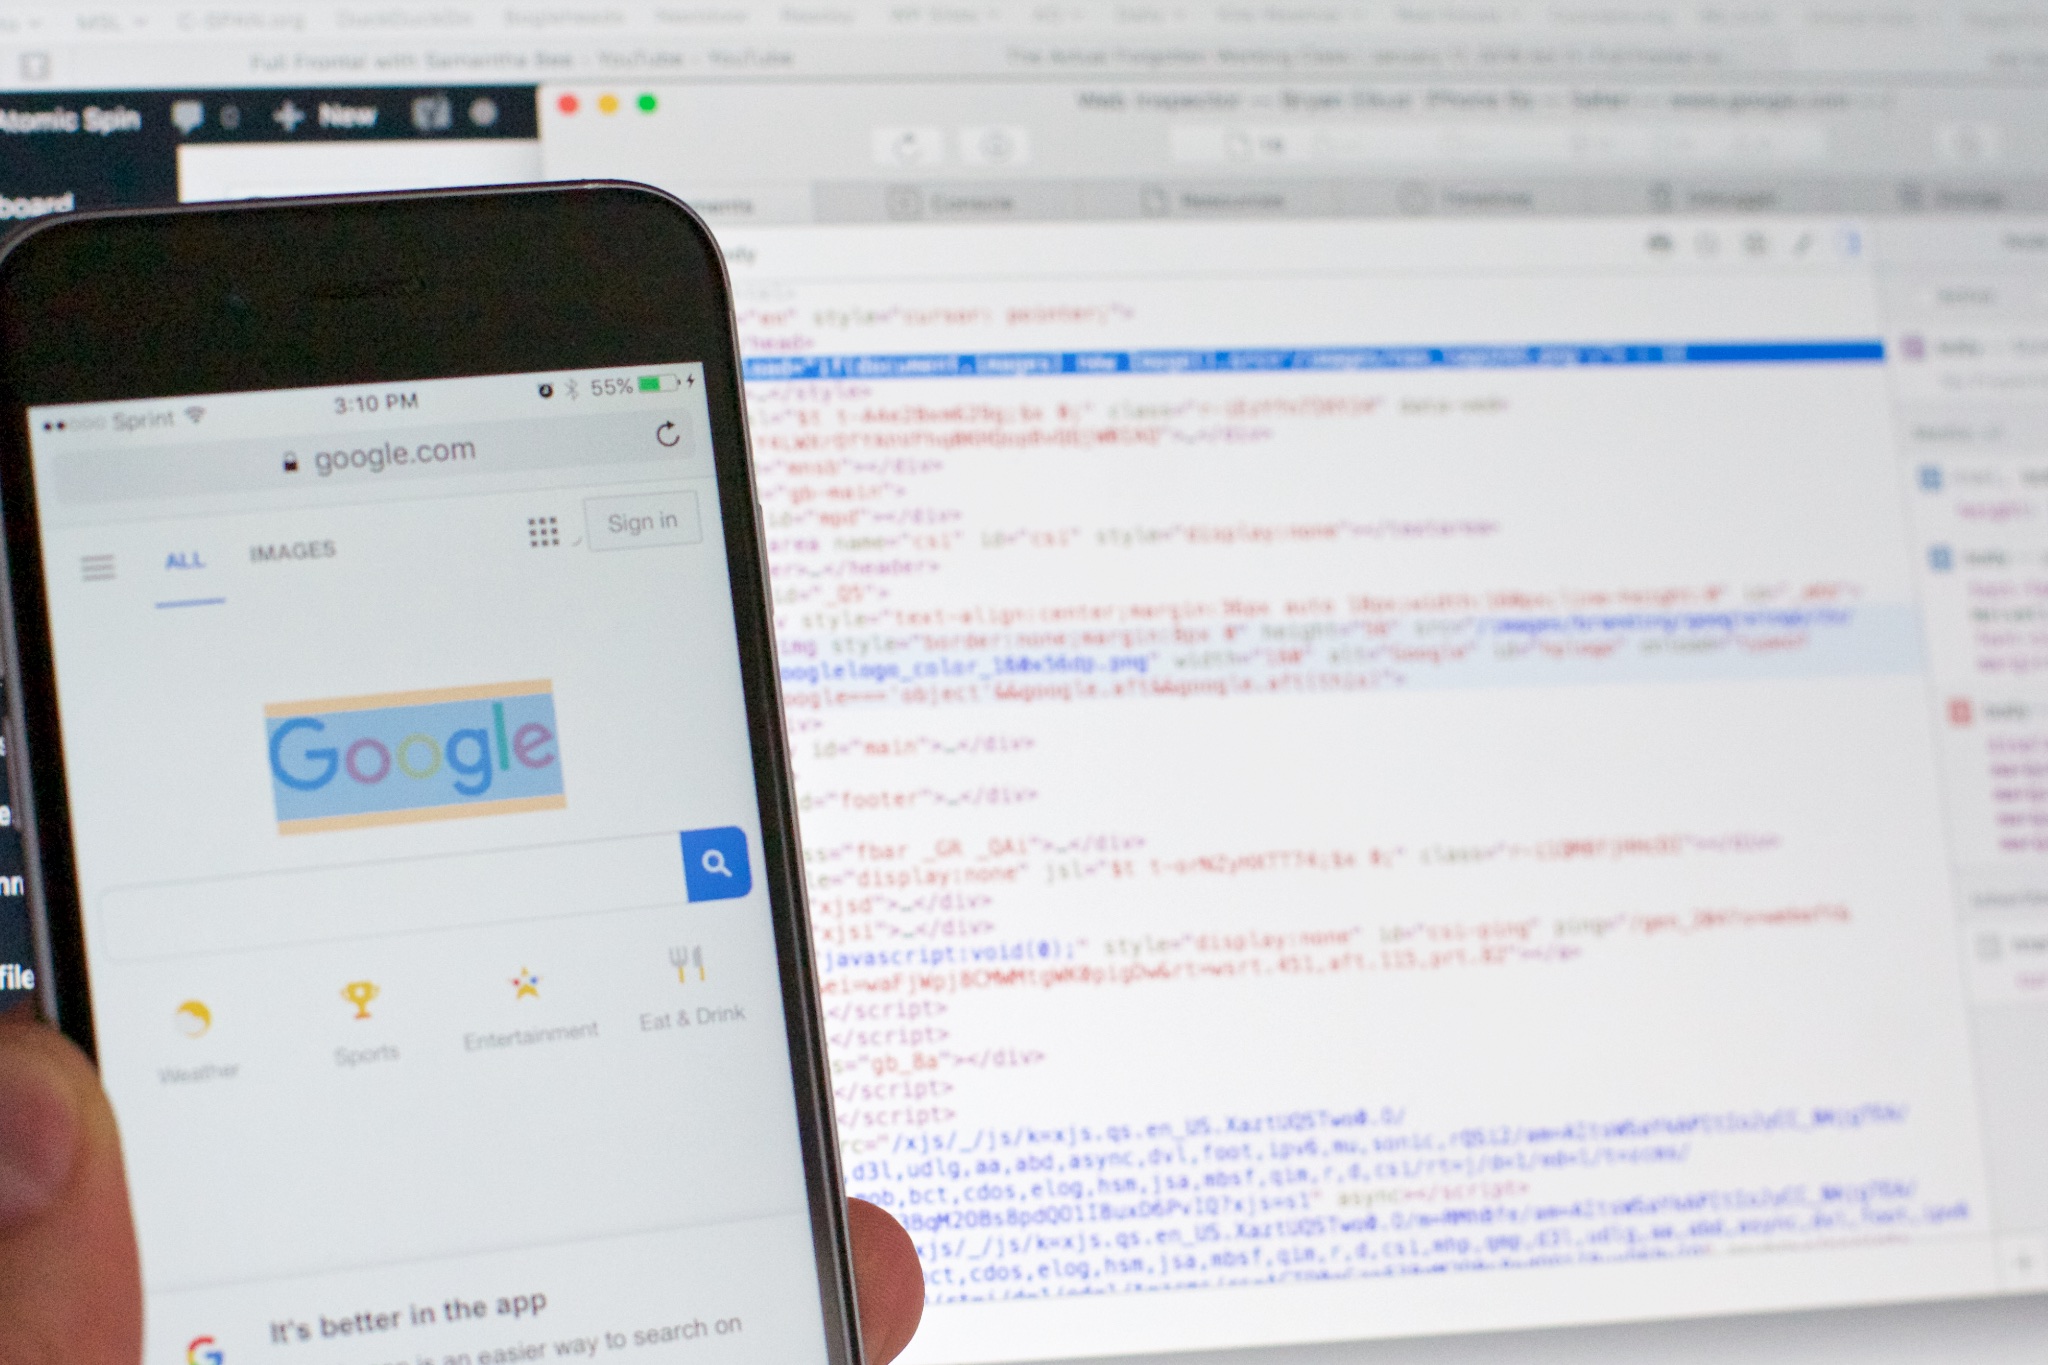
Inspecting the browser gives you access to the details of a website or application. Using built-in developer tools and third-party add-ons, we can view the inner workings of an application.
For example, you can see the content structure in DOM, view the console for logs or error messages, and review network requests for assets being loaded. When debugging a user interface problem, you can use the elements panel to modify live content on the screen, changing the content, type color, or button sizes.
By parsing though this information, you can often get to the bottom of your issue.
Why Inspect on a Device Mobile Browser?
Most browsers now have tools to mimic devices such as tablets and mobiles, so you can inspect and debug right on your computer. This has been extremely helpful in developing and testing our work, but sometimes, it doesn’t go far enough.
Because this solution is just emulating a mobile device, it doesn’t always have the same oddities as the actual device. Fortunately, you can plug in a device and inspect it just as you would with a normal browser on your computer.
Let’s walk through an example using Safari.
Set Up OSX Safari for Inspection
For this solution to work, both your device and computer need to be properly configured. In our example, we’ll be using OSX Safari on an iPhone with iOS 10 and a Macbook Pro.
Set up your device
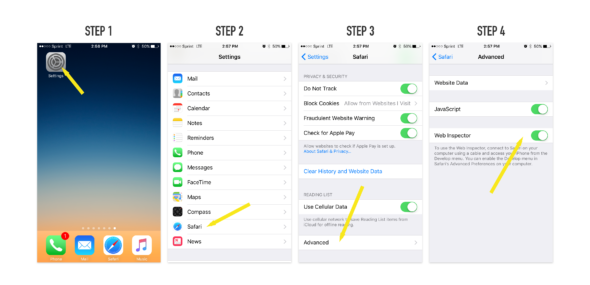
- Click Setting to access your general iPhone Settings.
- Scroll and select Safari’s Settings.
- Scroll and select Advanced.
- Toggle the Web Inspector to On.
Set up your computer
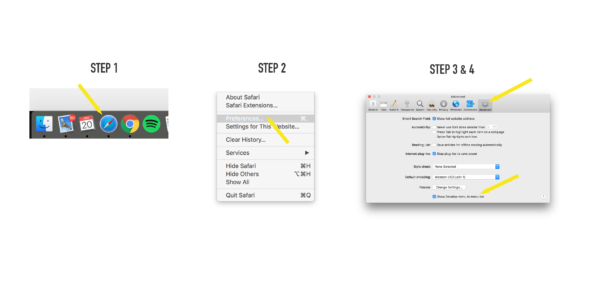
- Open Safari.
- Open Preferences from the File Safari dropdown menu.
- Click the Advance tab in the options.
- Turn on Show Develop menu in menu bar.
Great! We’re almost there.
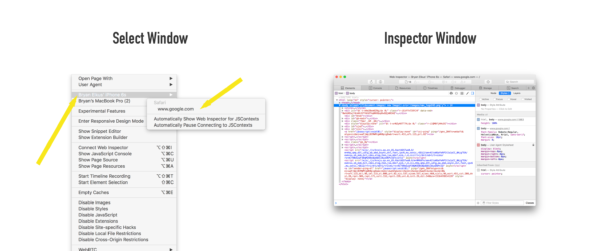
Now plug your device into the computer via USB. Using the mobile device, navigate to a page or application you want to inspect.
Next, shift over to your computer. With Safari open, select the Develop menu in the menu bar. Toward the top of that list, you should see your device’s name and the windows that are available to inspect. Select the page or application to inspect, and the inspection window will open.
From here, the review process works the same as it would if you were inspecting a window on your local machine. There are a couple of drawbacks such as not being able to target an element with your mouse or right-click to inspect an element. Instead, you’ll have to navigate up and down the DOM tree or leverage the find feature via Command + F in the inspect window.
This method has allowed us to fix difficult bugs as well as test and prototype right in the native browser. Give it a try next time you’re in that situation.
ADFD
Hello, i believe that i noticed you visited my web site so i got here to return the favor?.I’m attempting to to find things to enhance my website!I guess its ok to make use of a few of your ideas!!|