Recently, I was tasked with writing some code to generate Excel workbooks containing sales data. I implemented the code using a Node module called ExcelJS. I found that this module provides a simple interface to generating documents, and it also supports more advanced functions such as text formatting, borders, formulae, and more.
We’ll begin by defining a simple interface which contains our sales data.
interface WeeklySalesNumbers {
  product: string;
  week1: number;
  week2: number;
  week3: number;
}

const numbers: WeeklySalesNumbers[] = [
  { product: 'Product A', week1: 5, week2: 10, week3: 27 },
  { product: 'Product B', week1: 5, week2: 5, week3: 11 },
  { product: 'Product C', week1: 1, week2: 2, week3: 3 },
  { product: 'Product D', week1: 6, week2: 1, week3: 2 },
];
Then, we’ll start on our function to generate the workbook. A function call creates the workbook, and then another adds a worksheet to our workbook. We’ll call this “Sales Data.”
async function generateSalesReport(weeklySalesNumbers: WeeklySalesNumbers[]) {
  const workbook = new Excel.Workbook();
  const worksheet = workbook.addWorksheet('Sales Data');
Next, we’ll define a list of columns that’ll be added to our worksheet. This is a feature provided by the ExcelJS module which allows us to assign values in the worksheet using a key-value pair.
    { header: 'Product ID', key: 'product', width: 20 },
    { header: 'Week 1', key: 'week1', width: 10 },
    { header: 'Week 2', key: 'week2', width: 10 },
    { header: 'Week 3', key: 'week3', width: 10 },
    { header: 'Product Totals', key: 'productTotals', width: 12 },
  ];
Then, we’ll add our sales numbers to the worksheet. For each row, we’ll use a formula function (defined later) to add a column that shows the total sales for each product.
  weeklySalesNumbers.forEach((data, index) => {
    worksheet.addRow({
      ...data,
      productTotals: generateProductTotalsCell(worksheet, index + 1),
    });
  });
Next, we’ll use a formula function (also defined later) to add a row that shows the total sales for all products each week.
  const totalsRow = worksheet.addRow([
  'Weekly Totals',
    generateWeeklyTotalsCell(worksheet, 'B', weeklySalesNumbers.length),
    generateWeeklyTotalsCell(worksheet, 'C', weeklySalesNumbers.length),
    generateWeeklyTotalsCell(worksheet, 'D', weeklySalesNumbers.length),
    generateWeeklyTotalsCell(worksheet, 'E', weeklySalesNumbers.length),
  ]);
Then, we’ll add some formatting. We can bold the first (heading) row and the totals row. In addition, we’ll add some borders on the totals row to indicate that it is a summation.
  worksheet.getRow(1).eachCell((cell) => {
    cell.font = { bold: true };
  });

  totalsRow.eachCell((cell) => {
    cell.font = { bold: true };
    cell.border = {
      top: { style: 'thin' }, bottom: { style: 'double' },
    };
  });
Next, we’ll freeze the panes so that the user of the spreadsheet can always have the product and columns in view when scrolling.
  worksheet.views = [
    { state: 'frozen', xSplit: 1, ySplit: 1, activeCell: 'B2' },
  ];
Then, we’ll write the workbook out to a file and finish up our function.
  await workbook.xlsx.writeFile('sales-report.xlsx');
}
Next, we’ll create our function to generate the product total cells that are to the right of each of the product sales data. This generates a cell formula using the SUM function provided by Excel.
function generateProductTotalsCell(worksheet: Excel.Worksheet, rowIndex: number) {
  const firstColumn = 'B';
  const lastColumn = 'D';

  const firstCellReference = `${firstColumn}${rowIndex + HeaderRowsCount}`;
  const lastCellReference = `${lastColumn}${rowIndex + HeaderRowsCount}`;

  const sumRange = `${firstCellReference}:${lastCellReference}`;

  return {
    formula: `SUM(${sumRange})`,
  };
}
Finally, we’ll create another function that generates the weekly totals that will be at the bottom of the sales data. This function is very similar to what we’ve discussed above, but it works on columns rather than rows.
function generateWeeklyTotalsCell(worksheet: Excel.Worksheet, columnLetter: string, totalDataRows: number) {
  const firstDataRow = HeaderRowsCount + 1;
  const lastDataRow = firstDataRow + totalDataRows - 1;

  const firstCellReference = `${columnLetter}${firstDataRow}`;
  const lastCellReference = `${columnLetter}${lastDataRow}`;
  const sumRange = `${firstCellReference}:${lastCellReference}`;

  return {
    formula: `SUM(${sumRange})`,
  };
}
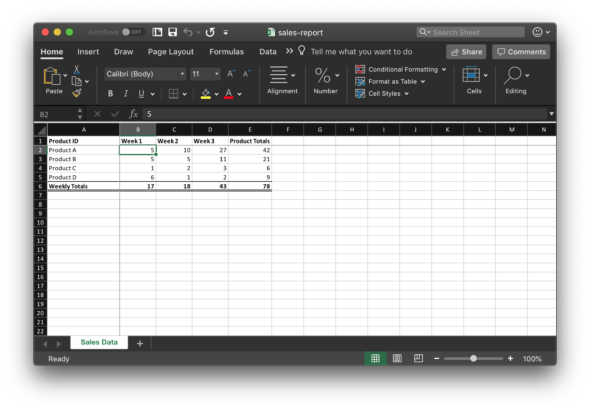
When we open the file in Excel, we get a nice-looking spreadsheet.

Although this is a simple example, the ExcelJS module has allowed our project team to quickly and easily generate complex reports needed by our users.


An easier way is to use http://carbone.io/ ^^
someona has this example without typescript? just js
someone has this example without typescript? just js
Have you did list validations?
It needs some weird data type array like [‘ “Man,Woman” ‘]
which I need to convert from [“Man”, “Woman”]
Any suggestions?