Article summary
Update – I’ve since discovered an easier way to get a fully-functional bare-metal toolchain. See my updated post here.
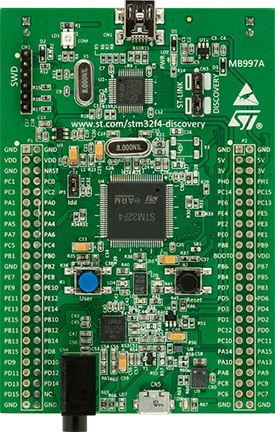
 I recently picked up a STM32F4 Discovery board to play around with, and have been having a bunch of fun with it.
While there are a few good articles already out there about building toolchains targeting bare-metal Cortex processors, many are already out of date, and I struggled to find anything that really went through the whole process of setting up a full development chain for the STM32F4 Discovery board.
Here’s my process, including programming and debugging capabilities using the built-in ST-Link v2 setup.
Building
Since we’ll be compiling GCC, you’ll need some compiler already installed on your system, so grab XCode, the XCode Command Line Tools, or use something like the osx-gcc-installer. You’ll also require a few miscellaneous dependencies, so grab them from Homebrew.
brew install mpfr gmp libmpc texinfo libusb-compat libftdi wget
Next, you’ll need to actually install a compiler and related utilities. There are a few good scripts already out there, but they didn’t quite suit my purposes. The CodeSourcery Lite toolchain installed by jsnyder’s arm-eabi-toolchain script doesn’t have hardware float support for the Cortex M4F in the STM32F4 microcontrollers. The summon-arm-toolchain uses Linaro’s gcc, which has hardware floating point but also has some microcontroller support libraries I’d rather keep with my projects. As such, I modified the summon-arm-toolchain script and also enabled st-link support. You can clone my fork here: https://github.com/ehntoo/summon-arm-toolchain.
After cloning the repository, all you need to do is run ./summon-arm-toolchain, and it will fetch, compile, and install GCC, GDB, newlib, binutils, and OpenOCD. All tools are installed into ~/sat/ by default so as to not interfere with anything you’ve already got on your system.
Connecting
To actually get started developing on the hardware, you’ll need to fire up OpenOCD.
openocd -f board/stm32f4discovery.cfg
You should see a whole bunch of libusb debug info scroll by, followed by Info : stm32f4x.cpu: hardware has 6 breakpoints, 4 watchpoints. Congratulations, you’ve connected to your processor via SWD!
A full overview of OpenOCD’s capabilities would be well outside the scope of this blog post, but flashing a hex or bin file can be done fairly simply, for example re-flashing the ST demo firmware.
galahad:~ mitch$ telnet localhost 4444
Trying ::1...
telnet: connect to address ::1: Connection refused
Trying 127.0.0.1...
Connected to localhost.
Escape character is '^]'.
Open On-Chip Debugger

> reset halt
target state: halted
target halted due to debug-request, current mode: Thread
xPSR: 0x01000000 pc: 0x08005e08 msp: 0x20000c68

> write_image erase /Users/mitch/STM32F4-Discovery_FW_V1.1.0/Project/Demonstration/Binary/STM32F4-Discovery_Demonstration_V1.0.0.hex
auto erase enabled
target state: halted
target halted due to breakpoint, current mode: Thread
xPSR: 0x61000000 pc: 0x20000042 msp: 0x20000c68
wrote 32768 bytes from file /Users/mitch/STM32F4-Discovery_FW_V1.1.0/Project/Demonstration/Binary/STM32F4-Discovery_Demonstration_V1.0.0.hex in 1.496964s (21.377 KiB/s)

> verify_image  /Users/mitch/STM32F4-Discovery_FW_V1.1.0/Project/Demonstration/Binary/STM32F4-Discovery_Demonstration_V1.0.0.hex
target state: halted
target halted due to breakpoint, current mode: Thread
xPSR: 0x61000000 pc: 0x2000002e msp: 0x20000c68
verified 25104 bytes in 0.235759s (103.986 KiB/s)

> reset run
OpenOCD also provides a GDB server implementation that you can connect to with the GDB you built as part of the summon-arm-toolchain installation.
galahad:~ mitch$ arm-none-eabi-gdb
(gdb) target remote localhost:3333
Remote debugging using localhost:3333
0x08005e08 in ?? ()
(gdb) file ~/ChibiOS_2.4.3/demos/ARMCM4-STM32F407-DISCOVERY/build/ch.elf
A program is being debugged already.
Are you sure you want to change the file? (y or n) y
Reading symbols from /Users/mitch/ChibiOS_2.4.3/demos/ARMCM4-STM32F407-DISCOVERY/build/ch.elf...done.
(gdb) monitor reset halt
target state: halted
target halted due to debug-request, current mode: Thread
xPSR: 0x01000000 pc: 0x08005e08 msp: 0x20000c68
(gdb) load
Loading section startup, size 0x188 lma 0x8000000
Loading section .text, size 0xc5ec lma 0x8000190
Loading section .data, size 0x110 lma 0x800c780
Start address 0x8000190, load size 51332
Transfer rate: 18 KB/sec, 8555 bytes/write.
(gdb)
From here, you can use standard GDB methods to debug your application. Have fun!

The GCC sources comes with a script (contrib/download_prerequisites) that downloads the necessary dependencies so that they will be built statically along with the compiler. This is far preferable than building them as separate dynamic libraries.
Also you can avoid all the trouble and install the toolchain from Macports.
I just got my STM32FDISCOVERY board yesterday, and curious if I’d be able to get debugging and programming working with Eclipse at all?
While I haven’t actually done this myself, there are a few guides on doing just this. This is the one I have bookmarked in my own browser – http://www.alexwhittemore.com/open-source-ide-and-toolchain-for-the-stm32f4-discovery-on-mac-osx-lion/