Article summary
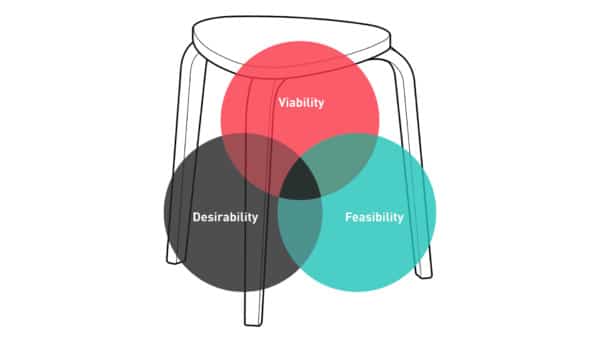
Ok, that title is unfair. It’s not a lie, but, in reality, the three-legged stool (or Venn diagram showing viability, feasibility, and desirability) of innovation is a barely adequate metaphor to communicate a specific message. Therein lies the rub: it’s only apt for a very specific message.
I first discovered this breakdown when I came across a LinkedIn post by Pavel Samsonov where he dives deeper into the metaphor to identify how these elements truly play out. At the time, this resonated with me because I was in the middle of a project where the team struggled to gain traction. Pavel’s explanation had serious merit in providing a way for us to understand our struggles. So, to better clarify things for myself, I explored it further and conducted my own thought experiment exercise. The rest of this post is the result.
The IKEA manual for the three-legged stool of innovation.
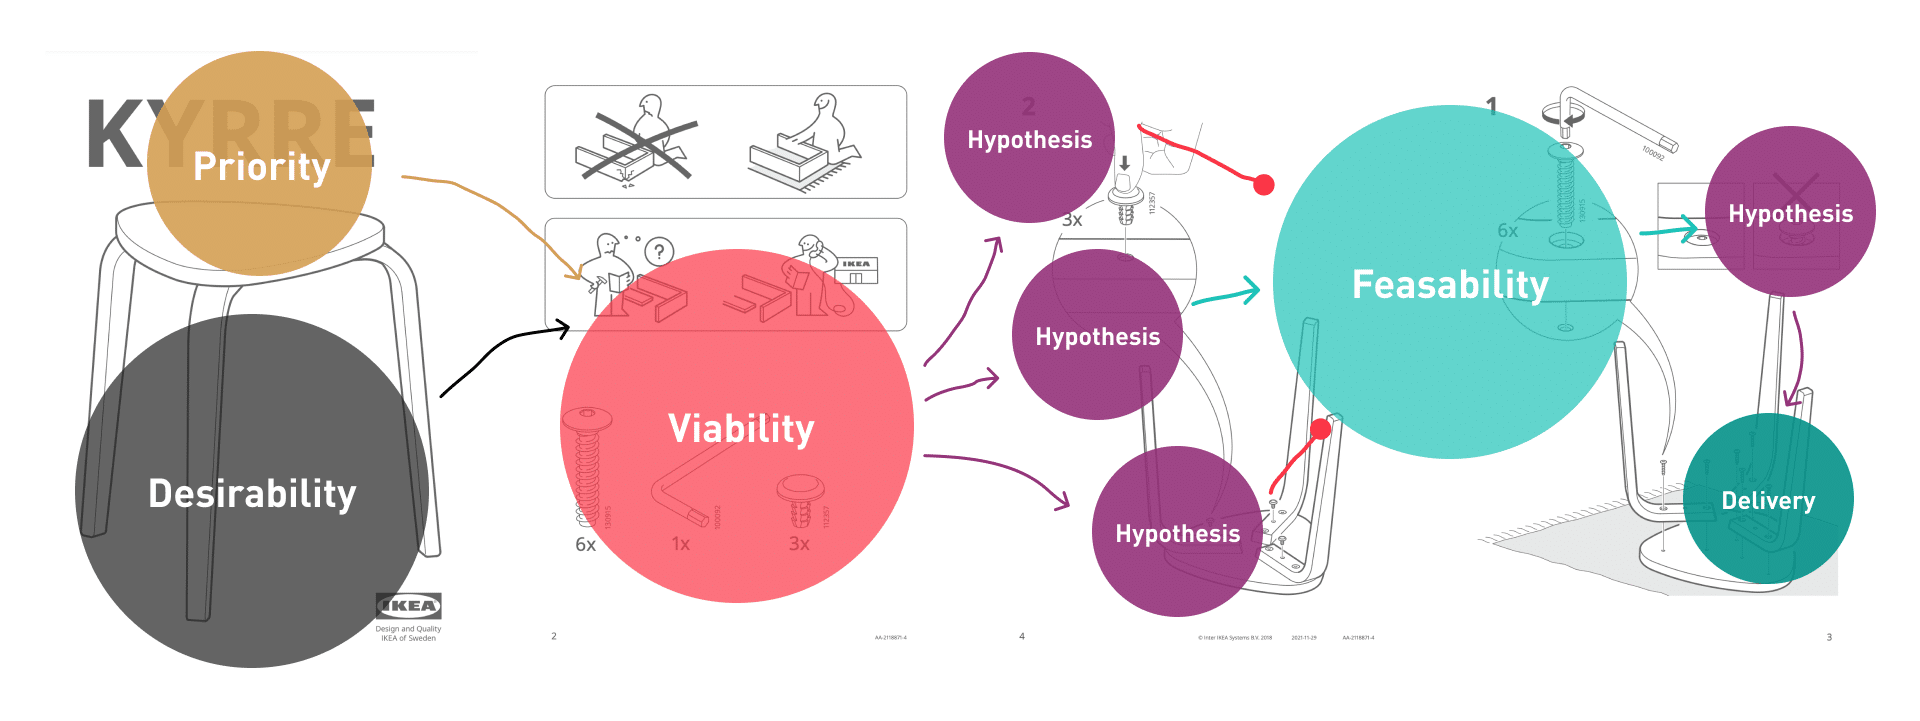
If I had to summarize the foundation of Pavel’s message, it is that, in actuality, the balanced viability, feasibility, and desirability metaphor is better represented as a semi-linear flow. In other words, it’s a mature process constantly moving between the problem, solution, and delivery space. But, for the sake of this post, I’m calling it linear. So it’s more like an IKEA assembly manual for the stool. You need to understand what information comes first to reach valuable outcomes.
Feasibility is actually further down the flow than viability. But, more importantly, we must understand that viability is informed by the overlap of desirability and priority. Priority is what the business wants to achieve. Nothing is “viable” until it solves a business problem.
At this point, I started to translate the idea into something that fits more naturally into my own mental model. Namely, that was organizing the flow into spaces: the problem space, the solution space, and the delivery space.
The Problem Space

This is the area where we’re working to identify viability. We’re building an understanding of the various impact areas so we can decide what to work on. Remember that Pavel stated viability is the overlap of priority and desirability.

This is an important distinction, because, if the business doesn’t have a clear strategy for what it is trying to achieve, we’re left struggling to define true viability. Businesses without strategy end up with vague metrics disguised as viability. In turn, this leads teams to moving into the solution space, trying to solve for better NPS scores. The cost of this deficit is that teams should use the business’s strategy to guide what customer problems they want to try and solve. Without a strong priority, teams must guess and might choose to solve customer problems that won’t ultimately deliver real value.

The Solution Space
Identifying a viable approach is our transition into the solution space. This is where we can identify a range of potential solutions before running them through our feasibility filter.

At this stage, we’re developing a host of hypotheses for how to solve the customer’s needs in a way that will deliver business outcomes. An effective hypothesis will have a belief statement for what we want to test, a verification plan for how it will be tested, and a measure so everyone is aligned on which hypotheses are successful. When we have our list of hypotheses it’s now time to run them through our feasibility filter. This is often informed by the original business priority because, as Pavel says, “If the expected ROI is high enough, we are willing to fund lots of things that seem infeasible.”
The Delivery Space
This is where prioritized hypotheses begin to be clarified, built, and released. You’d usually do this by breaking down the hypothesis into testable, buildable, and deliverable slices.

When we use the three-legged stool of innovation metaphor flippantly, without a deeper understanding of how the process breaks down, we risk underselling or blatantly misdirecting the audience we’re communicating with.