Article summary
When creating a single-page site using a technology like Ember or AngularJS, debugging code can become an issue. Firebug and the Chrome debugger quickly lose their power as you have to dig through Ember models and other representations of your application.
Thankfully, from the creators of Ember comes a plugin for Chrome debugging — Ember Inspector — which gives you quick access to Ember objects and data.
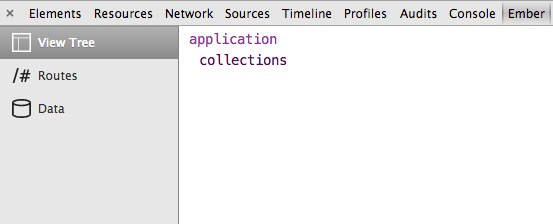
Tree View
The tree view visually allows you to walk through the different parts of your Ember application. This is useful for debugging but also helps to gain an understanding of how an Ember application is built up.
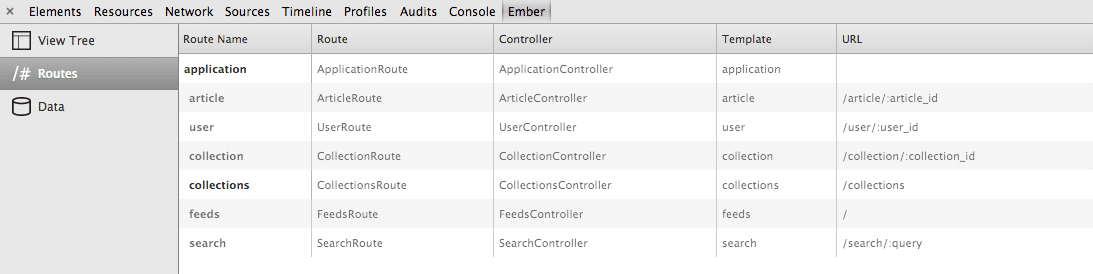
Route View
Route access provides a breakdown of each route in your Ember application. This is a very advanced version of `rake routes` in rails. Not only does it provide a view into what routes the application has defined, but it also breaks down the hierarchy, controllers to access and templates to load.
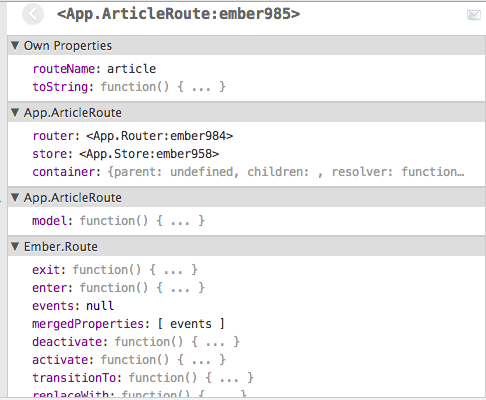
Route Detailed View
You can also inspect a route even further. This gives a nice breakdown on the routes API.
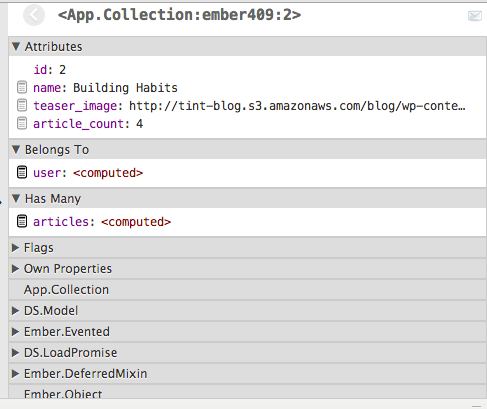
Data Option / Model View
The Data option gives you a much needed look into the guts of Ember-Data. You can dig into your models, check what’s been loaded and what’s new, and search for specific words.
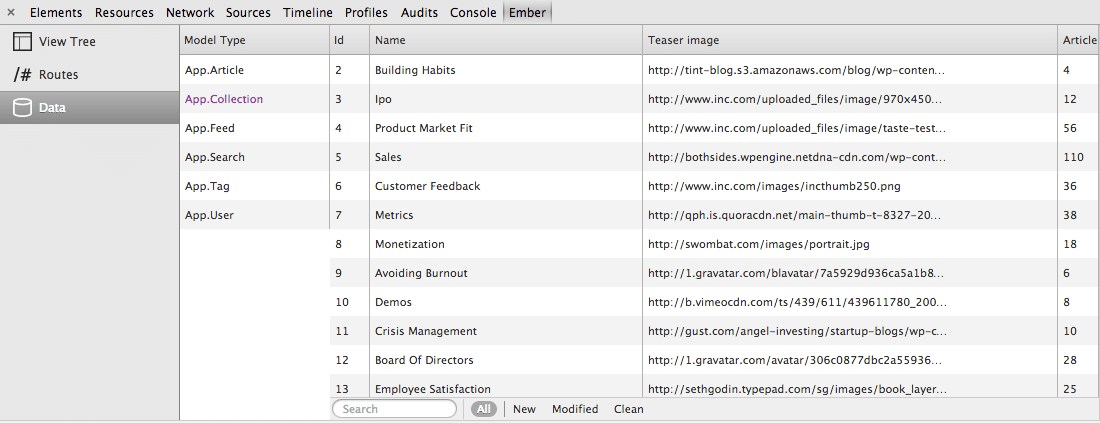
Open up an Ember model and view not only the properties loaded from your database but also what Ember-Data has added to the model.
Overall the Ember Inspector plugin is a great utility when developing an Ember website. I can see this being useful for any JavaScript Framework.
Hey Dustin… I am using Ember Inspection since it was launched and it is very helpful in a lot of situations, a indispensable tool for Ember.js Developers. Thanks for share with this growing community.