
Recently, I learned how important it is to regularly check database utilization in production environments. I often connect to our production database with TablePlus to pull up data for debugging, but I never thought to check storage space usage. But a few weeks ago, our client flagged a steady increase in utilization and asked us to take a look.
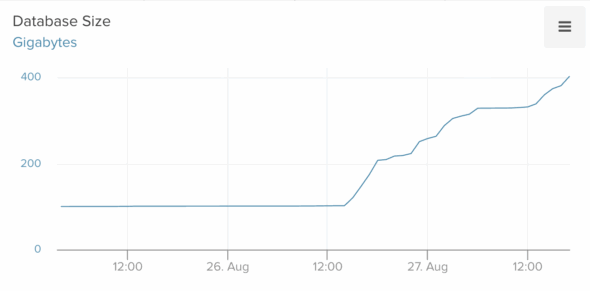
I opened the metrics dashboard in Heroku and quickly spotted the issue. The historical trend data for our Postgres utilization showed a sharp recent increase:
A quick fix (that didn’t work)
This immediately brought to mind a recent change I had made to use the database for temporary data storage. Millions of rows were being added and deleted every day. Unfortunately, I had overlooked an edge case, and 14 million rows piled up in just a few weeks.
I added logic to automatically delete old data and expected utilization to drop. Instead, it kept climbing—even after the cleanup task ran and removed 99% of the rows.
At this point, I started to panic. Storage was growing by 1–2 GB every few minutes. If deleting millions of rows didn’t help, something else was wrong. I turned to AI to uncover the root cause.
Diagnosing the root cause
I use Cursor for daily development, so I pointed it at the Django model for the bloated table. Cursor suggested that the JSON column combined with the constant churn was the culprit. The likely issue? TOAST bloat.
This was my first time hearing of TOAST, or The Oversized-Attribute Storage Technique. In short, Postgres uses TOAST to store large field values like JSON.
Cursor gave me a SQL query to check the TOAST data size. That’s when I realized just how much internal visibility Postgres offers:
SELECT pg_size_pretty(pg_relation_size('my_table_name')) AS table_only,
       pg_size_pretty(pg_indexes_size('my_table_name')) AS indexes_only,
       pg_size_pretty(pg_total_relation_size('my_table_name')) AS total_incl_toast;
The results confirmed a huge bloat ratio. Cursor then recommended tuning the autovacuum settings. To see when autovacuum last ran, I used this query:
SELECT relname,
       n_live_tup,
       n_dead_tup,
       last_vacuum,
       last_autovacuum,
       vacuum_count,
       autovacuum_count
FROM pg_stat_user_tables
WHERE schemaname = 'public' AND relname = 'my_table_name';
Autovacuum had run fewer than 20 times in the past couple of weeks, and millions of dead tuples had accumulated. We decided to run a manual vacuum. After waiting 45 minutes with no progress, I was worried the query might be blocked. ChatGPT provided another query to monitor vacuum progress:
SELECT
    a.pid,
    p.relid::regclass AS vacuumed_relation,
    CASE
        WHEN c.relkind = 't' THEN
            (SELECT mainc.relname || '.' || n.nspname
             FROM pg_class mainc
             JOIN pg_namespace n ON mainc.relnamespace = n.oid
             WHERE mainc.reltoastrelid = c.oid)
        ELSE NULL
    END AS parent_table,
    p.phase,
    p.heap_blks_total,
    p.heap_blks_scanned,
    p.heap_blks_vacuumed,
    p.index_vacuum_count,
    p.num_dead_tuples,
    p.max_dead_tuples
FROM pg_stat_progress_vacuum p
JOIN pg_stat_activity a ON a.pid = p.pid
JOIN pg_class c ON p.relid = c.oid;
Running this query multiple times showed steady progress as the heap_blks_scanned kept increasing. Hours later, the vacuum finally completed, removing millions of dead tuples. But by then, millions more had appeared. The utilization graph still climbed at the same rate. The real problem became clear: autovacuum wasn’t running often enough to keep up.
The real fix: Adjusting Postgres autovacuum settings
The solution was to update autovacuum settings on the table:
ALTER TABLE my_table_name
SET (
    autovacuum_vacuum_scale_factor = 0.01,
    autovacuum_vacuum_threshold = 1000,
    autovacuum_analyze_scale_factor = 0.02,
    autovacuum_vacuum_cost_limit = 2000,
    autovacuum_vacuum_insert_threshold = 1000
);
Immediately, a new autovacuum kicked off. When it finished, another started right away. Each run took less time. Soon, storage growth leveled off. After several more cycles, utilization finally dropped. Over the next 48 hours, usage fell from 500 GB back to about 60 GB—the original baseline. This was the true Postgres autovacuum TOAST bloat fix in action.
One Final Twist
The growth problem seemed solved, but I checked utilization daily. A week later, it had crept back to 80 GB. Alarm bells went off again.
Autovacuum had run recently, yet millions of dead tuples remained. None of the processes reached the vacuuming heap step. I asked AI for advice. It suggested looking for long-running queries with old backend_xmin values:
SELECT pid, usename, state, xact_start, backend_xmin, now()-xact_start AS age, query
FROM pg_stat_activity
WHERE backend_xmin IS NOT NULL
ORDER BY xact_start;
Sure enough, a query had been running for over an hour, doing a Cartesian product join across large tables. To confirm it was safe to cancel, I ran another diagnostic query:
SELECT
  pid, datname, usename, application_name, client_addr, client_port,
  backend_type, state, wait_event_type, wait_event,
  backend_start, xact_start, query_start,
  now()-xact_start  AS xact_age,
  now()-query_start AS query_age,
  backend_xmin,
  query
FROM pg_stat_activity
WHERE pid = 'pid for process';
The details suggested it was likely a manual query from another developer. I canceled it with select pg_cancel_backend(<problematic pid>). Within minutes, autovacuum kicked in, reached the vacuuming heap step, and restored stability. A few hours later, utilization dropped back to 60 GB and stayed there.
Takeaways
This stressful episode taught me three key lessons:
Don’t use Postgres for JSON with heavy churn. We’re migrating this data to Redis, which is better suited for high-churn operations. I won’t repeat this mistake in Postgres.
Set up automatic alerts. If the blocking query had happened later, I might not have checked utilization manually. It could have spiraled again. I built an automated task that checks every 10 minutes for high dead tuple counts or old backend_xmin values, posting to Slack if problems appear.
Explore Postgres internals. Postgres has tons of tables that expose interesting information about the internals. They’re well documented, which means it’s really effective to just tell Chat GPT what kind of information you’re looking for, and it can provide you with the exact query to run to extract that data.