
I often see developers trying to use console.log to debug their Angular applications, and I’ve been guilty of this as well. But let’s explore a much better way by using breakpoints and debug mode in JetBrains Webstorm.
Adding Breakpoints
While I hope most developers are familiar with this concept, let’s briefly review adding breakpoints in Webstorm. To start, open the TypeScript file that we want to debug. On the left-hand side, in the line number gutter, click to add a breakpoint on the selected line. You can also right-click on your breakpoint for more advanced settings, like adding a condition to the breakpoint.
Setting up Run Configurations
Generally, Webstorm will generate the required run configurations when you open the project for the first time. However, if you are missing these, let’s review the setup.
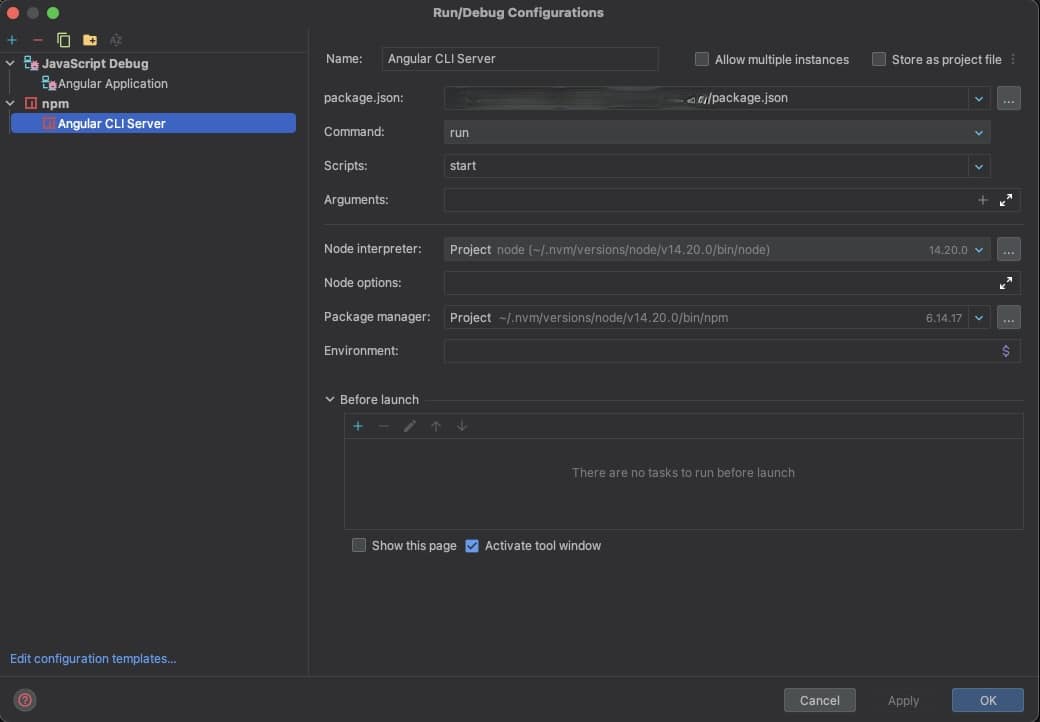
First, we will need a configuration for launching the Angular Live Development server. You should see the run configuration menu in the upper right-hand corner of Webstorm. Click on the drop-down and select “Edit Configurations…”. In the Run/Debug Configurations menu, click the “+” icon in the top left corner and select “npm”. We will name this configuration “Angular CLI Server”. By default, Webstorm should have detected your package.json file, but if not, make sure the path is correct.
For the command, choose “run,” and for the scripts, choose “start” (if you are using the standard Angular package.json settings, the “start” script should be ng serve). You will also want to make sure the node interpreter and package manager are set to the version of node and npm you are using in your project (which Webstorm should do by default).
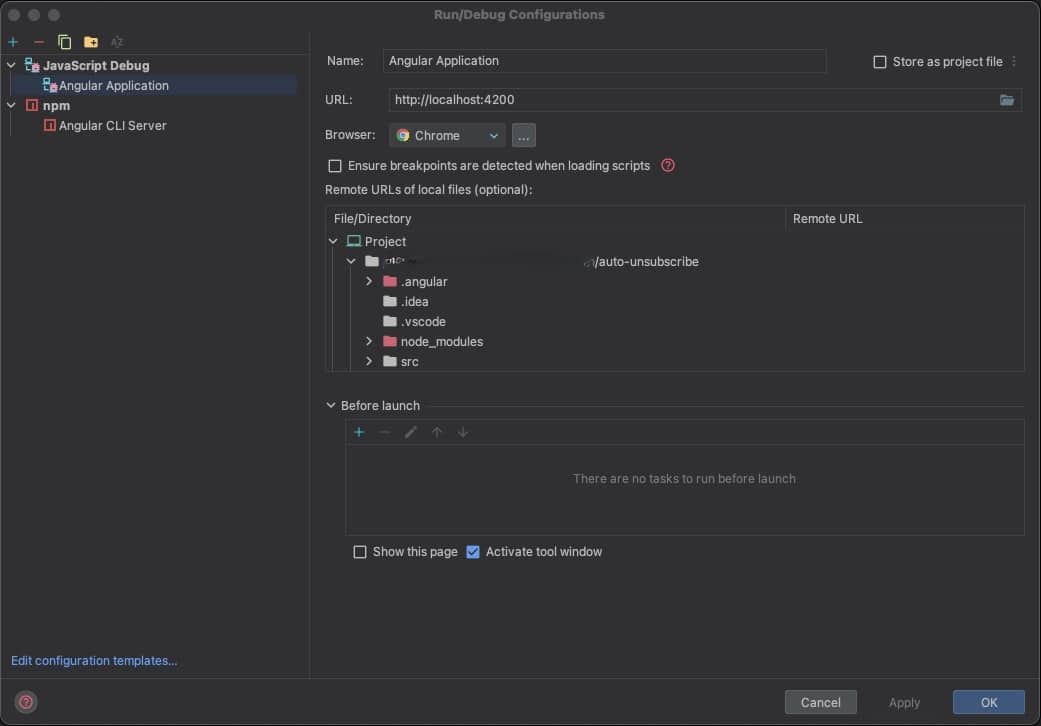
Next, we need a configuration for JavaScipt Debugging. In the Run/Debug Configurations menu, click the “+” icon and select “JavaScript Debug”. We will name this configuration “Angular Application” and only need to set the URL. We will set this as https://localhost:4200, which Angular applications use by default. If your application is configured differently, adjust the URL as appropriate.
Running the Angular Application in Debug Mode
Next, we will want to run our Angular application in debug mode so that when our program execution hits our breakpoints, we suspend execution. Click on the drop-down for run configurations and select your Angular CLI Server configuration. Next, click the “Debug” icon (or option+D if you’re on a Mac) to run the application in debug mode. The debug window will open. And, after the project has compiled successfully, you’ll get the familiar message that the Angular live development server is listening on localhost:4200 (or whichever port you have configured for your project).
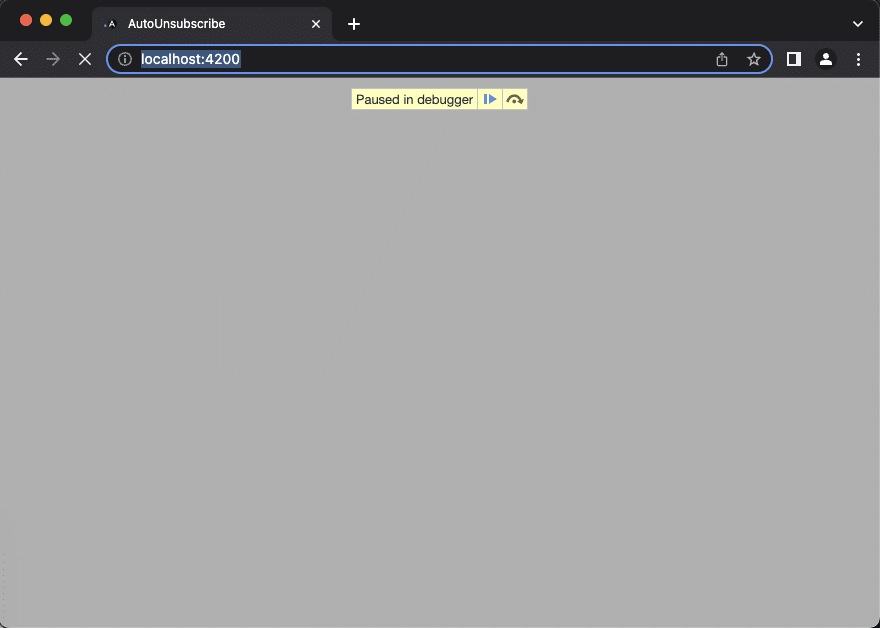
Now, choose the run configuration drop-down again, select your Angular Application Javascript Debug run configuration, and click the debug button. Chrome should now automatically open with https://localhost:4200.
Triggering the Breakpoint
Now, you will want to navigate to the area of the application that will trigger your brake point. For example, I set a breakpoint on an onClick function tied to a button. The chrome window will gray out when I click that button, and I see a small message “Paused in debugger.”
Over in Webstorm, you’ll notice a few things. First, the file with the breakpoint should have opened if it wasn’t open already, and you will see the breakpoint we added is now a green checkmark. You will also notice that the line we have suspended execution on is highlighted, and the current state of any of our variables should display their current values. The debug window will now also appear with all the tools you normally expect from a debugger.
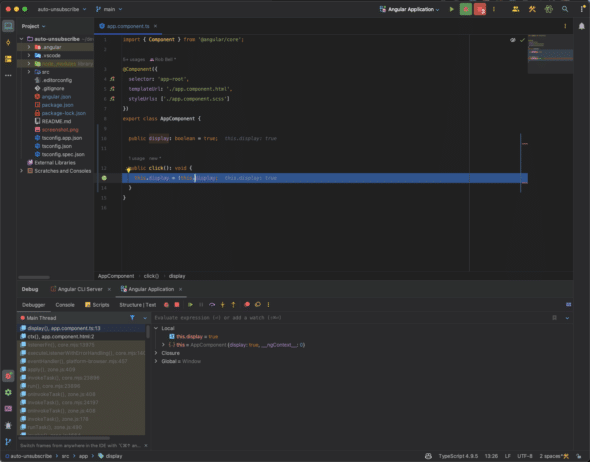
Now the full power of the Webstorm debugger is at your fingertips for your Angular application!