Article summary
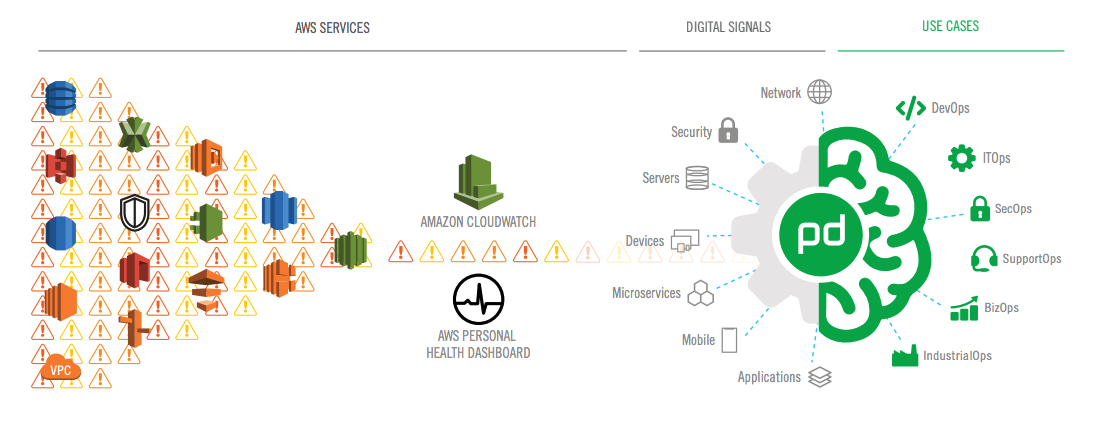
I use AWS Cloudwatch and PagerDuty together on a daily basis. Cloudwatch monitors your infrastructure in the AWS cloud environment. PagerDuty is a SaaS tool that specializes in incident response; it’s great for setting up monitoring alerts and notifying the correct person when something goes wrong in your infrastructure.
If you’re already using AWS Cloudwatch, integrating PagerDuty isn’t a hard task. There are two ways you can set up alerts with these two services: through integration on a PagerDuty service, or via Global Event Rules. I’d recommend Global Event Rules if you plan to build different alerts based on the payload from AWS.
Configure PagerDuty
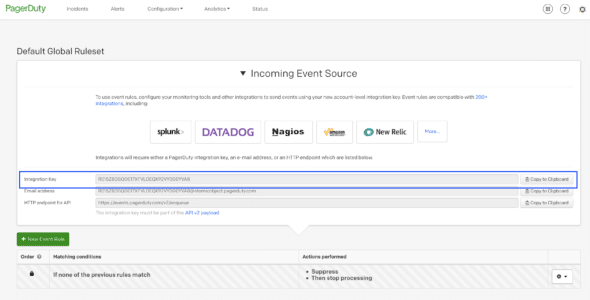
First, you need to configure PagerDuty. From the Configuration menu, select Event Rules. Copy your Integration Key from the Event Rules screen; the Integration URL will be https://events.pagerduty.com/x-ere/[YOUR_INTEGRATION_KEY].

Configure AWS Management Console
Now you can take this information to the AWS Management Console:
- Search for SNS (Simple Notification Service) in the Services bar at the top of the console. Select Topics and Create Topic.
- Enter a Topic Name. You will most likely want to keep this similar to the name of your PagerDuty service. Enter a Display Name, then click Create Topic.
- Select Subscriptions on the left side, then click Create Subscription.
- Make sure HTTPS is the selected protocol, then paste your Integration URL in the Endpoint field. Make sure “Enable raw message delivery” is unchecked. The subscription should now be automatically confirmed.
- At the top of the page in the Services field, search for ECS. Select Instances, then find the instance where you already have Cloudwatch alerts set up.
- Click the Instance checkbox, then click Actions. Select CloudWatch Monitoring, then select Add/Edit Alarms.
- Click Create Alarm and specify the parameters for your alarms.
PagerDuty will now send the infrastructure alerts to the right person.
There are more intricate ways to set up alarms in Cloudwatch and PagerDuty. Both allow for very specific metrics to be monitored, which is great when you need to find out what could’ve caused an unusual issue. They’re very powerful tools to use in unison with each other.


