Justin Kulesza and I have been using Puppet to manage the configuration of some virtualized servers. Recently, we added some modules that introduced unexpected dependency cycles. As we worked to untangle the complex series of dependencies, it became difficult to keep track of just how everything was connected.
In order to make sense of the complex web of chaining relationships, I decided to take advantage of Puppet’s ability to generate DOT graph files of resource relationships. Although it’s still sparsely documented [1], this option can be specified either on the command line or in puppet.conf.
Unfortunately, when we first took a look at the resulting relationships.dot for our configuration in GraphViz, it was hardly any help at all…
We could have spent a great deal of time manually searching this image for the resources that were interested in, but then I remembered another program that can read files in the DOT format: Gephi.
Gephi is an open source “interactive visualization and exploration platform for all kinds of networks and complex systems”. It can read, write, and manipulate a wide variety of graph data formats. In the past, I had used Gephi to analyze complex social networks. Here I decided to apply the tool to the complexity of infrastructure configuration.
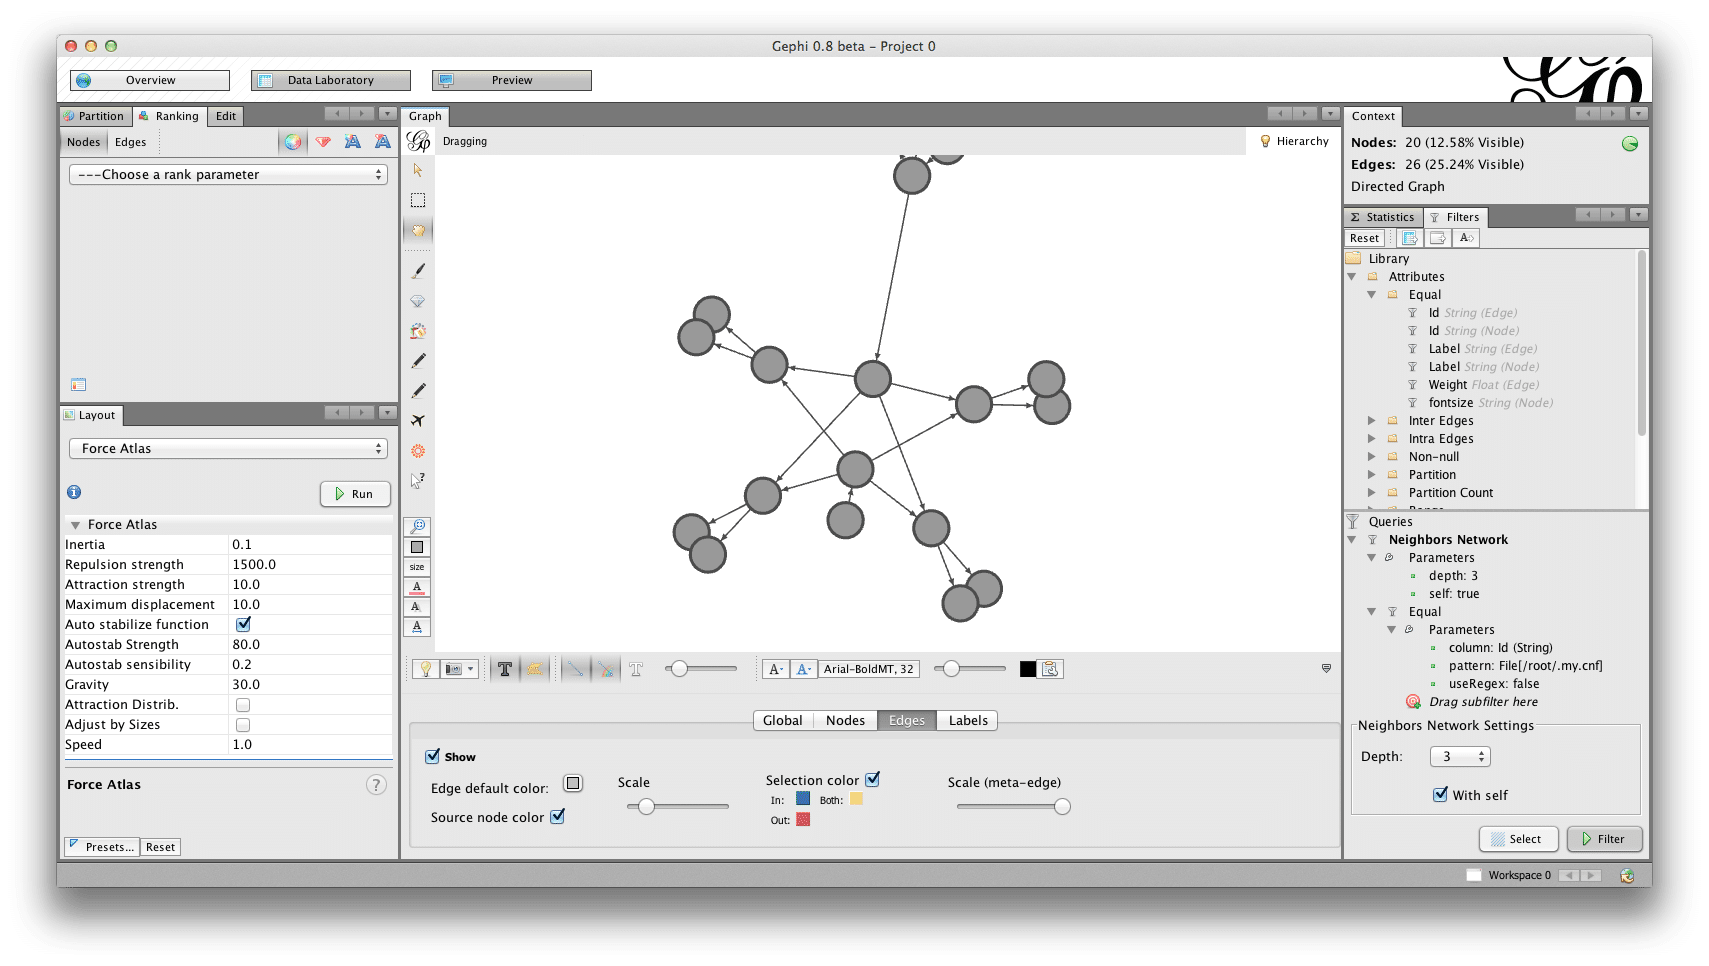
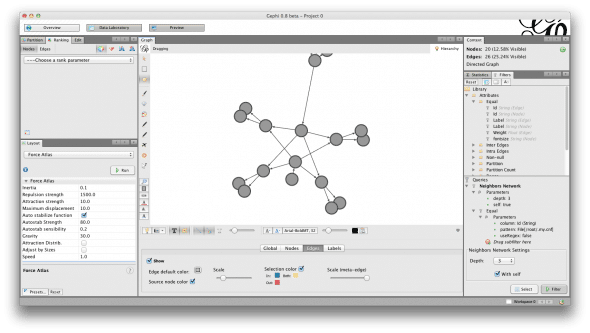
This is much better. With Gephi we were able to quickly filter the network of relationships down to only the resources closely related to the hypothesized problem area. Gephi also provided us access to much more powerful and flexible layout options.
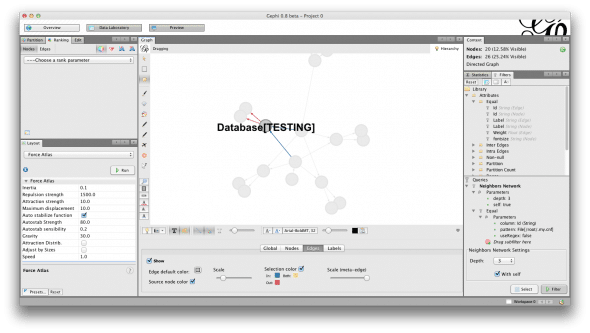
We can also see the direction of the dependency relationships without having to look for the arrow heads. Gephi has an option to interactively color inbound and outbound edges on a graph when you mouse over each node. Sweet.
By using tools like Puppet and Gephi to visualize our infrastructure configuration, we gain clarity and understanding of complex systems that might otherwise take years to obtain. More importantly perhaps, we are able to communicate that understanding to others. Having recourse to a visual representation in this case made it easy to pair on a complex task.
1.One reason for this might be that there are still some open questions about how best to represent the data.


[…] Puppet + Gephi: Visualizing Infrastructure as Code Use your resource graph for DevOpsy goodness. […]
[…] confronted with particularly complex and consequential tasks (i.e. refactoring Puppet manifests), Justin and I mitigate risks with ad hoc pairing. Tmux helps us pair on these tough problems by […]
Sweet.
Cool. I had a similar issue, but couldn’t get Gephi running on my mcahine. I ended up writing a little command-line python script using the graphviz and networkx python libraries, that reads the dot graph file and outputs a list of cycles in it. In case it’s of use to anyonw else, the instructions and source are at: http://blog.jasonantman.com/2012/03/python-script-to-find-dependency-cycles-in-graphviz-dot-files/
Thanks for sharing, Jason!
I’m glad you were able to find something that works for you.
NetworkX is one of my favorite Python libraries.
Out of curiosity, what prevented you from using Gephi? Is it too resource intensive, or does it not run on the JVM you’re using? The developers tend to be very responsive to feedback on the forums: https://forum.gephi.org/
-Mike
[…] networks Airlines Routes Network Analysis according to Gephi Visualizing Infrastructure as Code Ubuntu […]