
Article summary
Welcome to our series on Design Thinking methods and activities. You’ll find a full list of posts in this series at the end of the page.
Our next activity has us seabound: Speed Boat.
| Primary Goal | To understand obstacles preventing achievement of a goal |
| When to Use | When you want to assess risks, obstacles, or blockers |
| Time Required | On average, 30-60 minutes (add more if you’re running the advanced edition of this activity) |
| Number of Participants | 1 facilitator and 2-10+ participants |
| Who Should Participate? | Any portion or combination of the team that needs insight into risks and blockers |
| Supplies | Large whiteboard or Post-it Tabletop Pad, Post-it notes, Sharpies, whiteboard markers, activity graphics (printed and cut out) |
Speed Boat is the activity you turn to when you want to interject a little life into your process while also framing the obstacles that are holding back the success of your project. Setting it up can be as quick or time-consuming as you’d like to make it. I tend to go the extra mile when it comes to prep-work because the added graphics really help people to engage in the work.
So what is Speed Boat? Simply put, it’s a metaphor that helps you visualize the obstacles that prevent you from achieving your goal. Your project or service is the boat, and anchors are the obstacles, risks, and/or uncompleted tasks preventing you from reaching your destination, the goal.
It’s so easy to get caught up in day-to-day activities that it can become hard to understand why goals aren’t being achieved or where areas of risk have bubbled up. Bust out this activity when you want a quick lay of the land, or in this case, the sea.
You can choose the basic or advanced version of this activity. I’ll begin with the simplest one.
Basic Edition
1. Prep
To begin, you’ll need a large whiteboard or wall space, activity graphics of a boat and several anchors, Post-it notes, Sharpies, whiteboard markers, and tape. If you don’t have access to a printer, you can draw the boat and anchors on the board or Post-its as you go, but I’ve found that printed cut-outs make it easier to see the images and move them freely about the board.
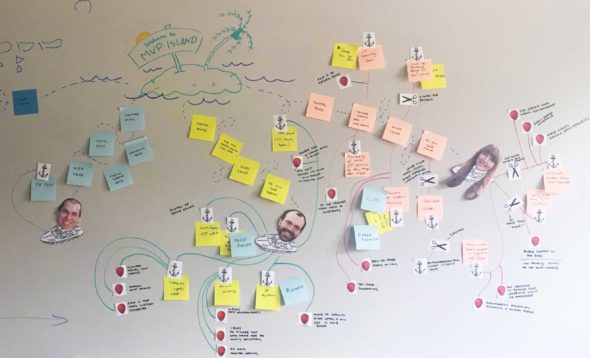
Tape your boat to the whiteboard and give it a name, mostly likely your project name. Next, draw an island and put the question you’d like answered at the center of it. This is where you can be really creative with how you structure the activity.
Product and service-related question examples
- What is preventing us from launching?
- Why are users slow to adopt our new technology?
- Why aren’t we standing out from the competition?
- What is preventing users from completing the checkout and payment process?
Personal or non-software related questions
These could be helpful if you’d like to use the framework for something other than project work.
- What is preventing us from achieving our financial goal (like saving for a home, car, or vacation)?
- What is holding me back from running a marathon?
- What is blocking me from having a deeper relationship with my significant other?
- What is keeping my family from gathering together at the dinner table every evening?
Finally, pass out Post-its and Sharpies to each participant, and scatter the anchors about the table so that everyone can grab them as needed.
2. Anchors away!
Present your island question, and explain that the anchors represent obstacles that are slowing down forward progress toward this goal.
Allow participants to ask clarifying questions, and then give them 10 minutes to begin listing anchors. Each Post-it should mention only one anchor.
Once the time is up, ask participants to describe their anchors one by one. Connect the anchors to the boat by sticking the Post-it notes to the board and drawing an anchor line between each note and the boat.
3. Wrap-up
Group any like observations, tasks, and insights together. Finally, ask the group to estimate how much faster the boat would go if all the anchors were cut free.
Take your findings and list them in a spreadsheet, mind map, or backlog so you can keep track of them. You might need to assign owners and dates to some items or tasks to keep moving forward.
Advanced Edition
Now that you understand the core activity, we’re going to add in two extra elements: scissors and buoys. Scissors are the tasks or ideas that cut an anchor free altogether, and buoys relieve pressure from anchors, but don’t eliminate them completely.
These two extra steps or graphics can help you define solutions for your problems (a.k.a. anchors). They’re helpful if you have extra time and/or a very action-oriented team who wants to assess and take action.
However, they do add an extra 30 minutes or so to the activity, so take your time constraints and group size into consideration when scheduling. Running this activity can be done with a large team, but the process will be more time-consuming.
1. Prep
You’ll prep the activity the same way as the basic edition. However, for this version, there are a few additional graphics (the scissors and buoys) to print and cut ahead of time.
2. Advanced anchors away!
Once again, run the activity as you would in basic mode, all the way to the point where everyone has discussed and posted all of their anchors.
Now that the group has a good sense of everything that’s holding back the boat, ask everyone to gather around the whiteboard to collaboratively post buoys and snip anchor lines with the scissors.
Keep in mind, buoys are ideas, tasks, services, people, etc. that can help relieve pressure from an anchor but cannot cut the anchor line altogether. For example, if an anchor is “poor WIFI connectivity,” a buoy might be “adding another access point,” while a scissor would be “hard-wiring internet capabilities to the device.”
It’s easiest to review one anchor at a time so that the group can brainstorm ideas and discuss the challenges together. It’s also helpful to gain group consensus on how to solve a problem.
Finally, wrap up the activity in the same way as you would for the basic edition.
Final Thoughts
There are many ways to run Speed Boat, so be creative with your implementation. Most importantly, have fun! Visualizing project risks and obstacles in this way may seem cheesy, but it’s a much more pleasant exercise than wading through the soulless cells of a spreadsheet.
Leave a comment below if you’ve tried this activity, and keep your eyes out for our next activity, Visualizing the Vote!
Atomic’s Design Thinking Toolkit
- What Is Design Thinking?
- Your Design Thinking Supply List
- Activity 1 – The Love/Breakup Letter
- Activity 2 – Story Mapping
- Activity 3 – P.O.E.M.S.
- Activity 4 – Start Your Day
- Activity 5 – Remember the Future
- Activity 6 – Card Sorting
- Activity 7 – Competitors/Complementors Map
- Activity 8 – Difficulty & Importance Matrix
- Activity 9 – Rose, Bud, Thorn
- Activity 10 – Affinity Mapping
- Activity 11 – Speed Boat
- Activity 12 – Visualize The Vote
- Activity 13 – Hopes & Fears
- Activity 14 – I Like, I Wish, What If
- Activity 15 – How to Make Toast
- Activity 16 – How Might We…?
- Activity 17 – Alter Egos
- Activity 18 – What’s On Your Radar?
- Activity 19 – The Perfect Morning
- Activity 20 – 2×3
- Activity 21 – How Can I Help…?
- Activity 22 – Cover Story
- Activity 23 – Crazy 8s
- Activity 24 – Abstraction Ladder
- Activity 25 – Empathy Map
- Activity 26 – Worse Possible Idea
- Activity 27 – Pre-Project Survey
- Activity 28 – The Powers of Ten
- Activity 29 – SCAMPER
- Activity 30 – Design Studio
- Activity 31 – Forced Connections
This is an updated version of a post originally published in June 2018.